Unlock a world of possibilities! Login now and discover the exclusive benefits awaiting you.
- Qlik Community
- :
- Forums
- :
- Analytics & AI
- :
- Products & Topics
- :
- App Development
- :
- Unable to set Colors by Dynamic Dimension
- Subscribe to RSS Feed
- Mark Topic as New
- Mark Topic as Read
- Float this Topic for Current User
- Bookmark
- Subscribe
- Mute
- Printer Friendly Page
- Mark as New
- Bookmark
- Subscribe
- Mute
- Subscribe to RSS Feed
- Permalink
- Report Inappropriate Content
Unable to set Colors by Dynamic Dimension
Hi.
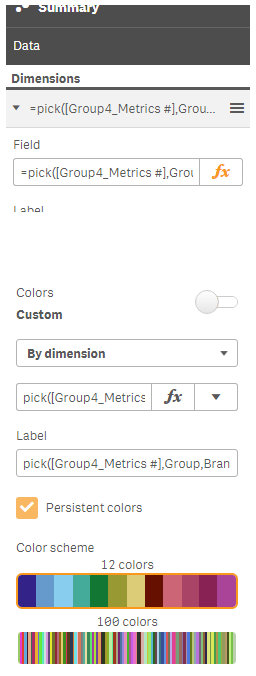
I’ve been working in some scatter plot charts to work with a dimension based on another selection using pick(field, Dim1, Dim2, Dim3) . It works fine, but not at the same way on Colors. The bubble colors are all gray. Shouldn't work since I’m able to add an expression?
I’ve been using the 3.2 version.
Thanks
Accepted Solutions
- Mark as New
- Bookmark
- Subscribe
- Mute
- Subscribe to RSS Feed
- Permalink
- Report Inappropriate Content
Thanks. It solved!
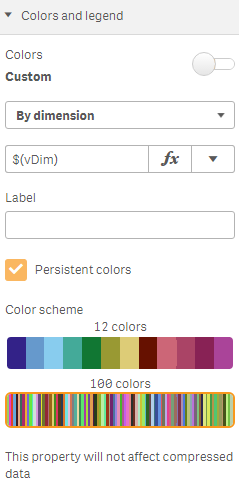
I simply created a variable with the expression =pick([NumericField], 'Dim1','Dim2','Dim3','Dim4') and I used this variable as an expression in by dimension color field. Now I'm able to change the chart dimension, keeping the color palette accordingly.

- Mark as New
- Bookmark
- Subscribe
- Mute
- Subscribe to RSS Feed
- Permalink
- Report Inappropriate Content
can you please share the sample data or QVF
- Mark as New
- Bookmark
- Subscribe
- Mute
- Subscribe to RSS Feed
- Permalink
- Report Inappropriate Content
Thanks. It solved!
I simply created a variable with the expression =pick([NumericField], 'Dim1','Dim2','Dim3','Dim4') and I used this variable as an expression in by dimension color field. Now I'm able to change the chart dimension, keeping the color palette accordingly.