Unlock a world of possibilities! Login now and discover the exclusive benefits awaiting you.
- Qlik Community
- :
- Forums
- :
- Analytics & AI
- :
- Products & Topics
- :
- App Development
- :
- Re: Using one field's value to select records from...
- Subscribe to RSS Feed
- Mark Topic as New
- Mark Topic as Read
- Float this Topic for Current User
- Bookmark
- Subscribe
- Mute
- Printer Friendly Page
- Mark as New
- Bookmark
- Subscribe
- Mute
- Subscribe to RSS Feed
- Permalink
- Report Inappropriate Content
Using one field's value to select records from another table.
Given the following tables
Studies:
load * inline [
study_country,plan_date,plan_count
3_usa,jan-2018,5
3_usa,feb-2018,7
3_usa,mar-2018,10
];
Sites:
load * inline [
study_country,study_site
3_usa,3_boston
3_usa,3_chicago
3_usa,3_philly
];
Subjects:
load * inline [
study_site,subj,enroll_date
3_boston,andy,jan-2018
3_boston,clara,feb-2018
3_philly,janet,feb-2018
];
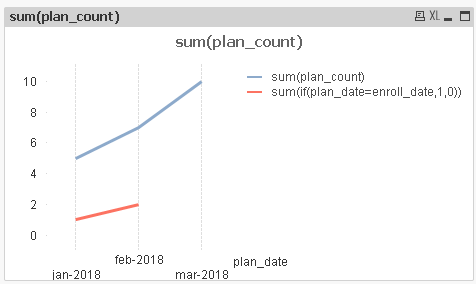
Is it possible to render a line chart with plan_date as the dimension and two measures:
1) sum(plan_count) // the planned enrollment for the study_country on any given plan_date.
2) a count of subjects who enrolled on the plan_date; ie enroll_date=plan_date
Thanks.
Accepted Solutions
- Mark as New
- Bookmark
- Subscribe
- Mute
- Subscribe to RSS Feed
- Permalink
- Report Inappropriate Content
- Mark as New
- Bookmark
- Subscribe
- Mute
- Subscribe to RSS Feed
- Permalink
- Report Inappropriate Content
Hi
is this you're expecting ?
regards
- Mark as New
- Bookmark
- Subscribe
- Mute
- Subscribe to RSS Feed
- Permalink
- Report Inappropriate Content
Thank you.