Unlock a world of possibilities! Login now and discover the exclusive benefits awaiting you.
- Qlik Community
- :
- Forums
- :
- Analytics & AI
- :
- Products & Topics
- :
- App Development
- :
- Re: Using the Match function with numeric expressi...
- Subscribe to RSS Feed
- Mark Topic as New
- Mark Topic as Read
- Float this Topic for Current User
- Bookmark
- Subscribe
- Mute
- Printer Friendly Page
- Mark as New
- Bookmark
- Subscribe
- Mute
- Subscribe to RSS Feed
- Permalink
- Report Inappropriate Content
Using the Match function with numeric expressions
For an expression in a table I am trying to use Match() to obtain an index matching a list of numeric expressions with the minimum (obtained using RangeMin). However, the function just returns a 1 (i.e. incorrectly matches with the first item in the list). The Help documentation talks in terms of the list containing string values, but this structure works OK with QlikView for numeric values (same data, same code).
Alternatively, is there another function that will do the job in QlikSense?
Thanks!
- « Previous Replies
-
- 1
- 2
- Next Replies »
- Mark as New
- Bookmark
- Subscribe
- Mute
- Subscribe to RSS Feed
- Permalink
- Report Inappropriate Content
hi - i read your post and looked at the app but it wasn't obvious to me what the issue was , even once i tracked down the expression you had referenced
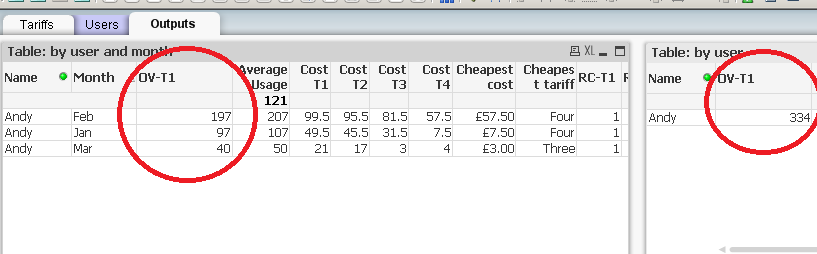
Basde on the expression formula you typed above, i believe you are directly referring to 'OV-T1' expression in large and small charts on the 'outputs' tab.
Is that correct ?
I did not see a difference in the totals ? Can you help explain ? or does this give you different results on your machine ?
- Mark as New
- Bookmark
- Subscribe
- Mute
- Subscribe to RSS Feed
- Permalink
- Report Inappropriate Content
FieldValue() returns the nth value of distinct values for that field. It does not return a value from the "nth" row. Given only 3 possible values, it's expected that
FieldValue('My field', 4),
would return null.
-Rob
- Mark as New
- Bookmark
- Subscribe
- Mute
- Subscribe to RSS Feed
- Permalink
- Report Inappropriate Content
If you want to pull values from the 4th row for your T4 expression, you can use a reference to unique row value like [Tarrif Name]
only({<[Tariff Name]={Four}>}[Rental per month])+
RangeMax(sum([Monthly usage])- only({<[Tariff Name]={Four}>}[Inclusive units]),0) *
only({<[Tariff Name]={Four}>}[Cost per non-inclusive unit])
-Rob
- Mark as New
- Bookmark
- Subscribe
- Mute
- Subscribe to RSS Feed
- Permalink
- Report Inappropriate Content
It produces correct results for Andy for OV-T1, but not for Colin and some other results are also incorrect.
- Mark as New
- Bookmark
- Subscribe
- Mute
- Subscribe to RSS Feed
- Permalink
- Report Inappropriate Content
Hi Rob,
The Only() structure appears to work well at extracting values from the Tariffs table - Thanks!
However, the problem now is that the chart calculates the *total* overage (i.e. summed across the three months) and then applies the rest of the calculation to that. What I want it to do is to do the calculation month by month and then to sum the results..
I guess that this will require an aggregation function ( Aggr() ?), but I can't seem to get this to work.
Thanks,
Leo
- « Previous Replies
-
- 1
- 2
- Next Replies »