Unlock a world of possibilities! Login now and discover the exclusive benefits awaiting you.
- Qlik Community
- :
- Forums
- :
- Analytics & AI
- :
- Products & Topics
- :
- App Development
- :
- Re: Using the average function of a sum in fronten...
- Subscribe to RSS Feed
- Mark Topic as New
- Mark Topic as Read
- Float this Topic for Current User
- Bookmark
- Subscribe
- Mute
- Printer Friendly Page
- Mark as New
- Bookmark
- Subscribe
- Mute
- Subscribe to RSS Feed
- Permalink
- Report Inappropriate Content
Using the average function of a sum in frontend
Hello,
I'm trying to use the average function in the frontend to calculate the average value for a sum of two fields.
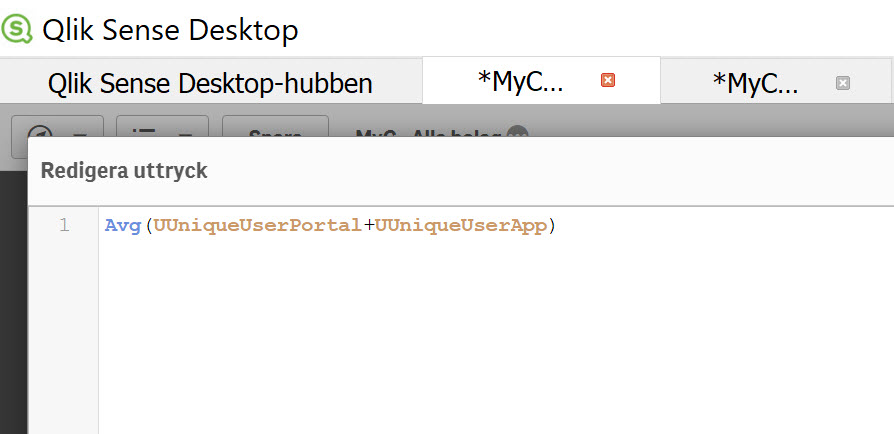
My expression in frontend looks like this: Avg(UUniqueUserPortal+UUniqueUserApp).
I've got no values by this expression....
What am I doing wrong in my expression? (When using only one variable at a time I've gott an average value)
The two fields UUniqueUserPortal and UUniqueUserApp come from two different files. My sqript look like this:
LOAD
LoginDate as ULoginDate,
Year(LoginDate) as UYear,
Week(LoginDate) as UWeek,
dual( Year(LoginDate) & '-' & Week(LoginDate), num(Year(LoginDate)) & num(Week(LoginDate), '00' )) as UYearWeek,
If(1=1,'Portal') as UType,
dual( Year(LoginDate) & '-' & Month(LoginDate), num(Year(LoginDate)) & num(Month(LoginDate), '00' )) as UYearMonth,
If(num(weekday(LoginDate))<>6 and num(weekday(LoginDate))<>7,Count("UserId")) as UUniqueUserPortal
Group By LoginDate;
SQL SELECT *FROM "myloc_PROD_220".cacore.EnvUsersLog;
LOAD
LoginDate as Ulogindate,
Year(LoginDate) as UYear,
Week(LoginDate) as UWeek,
dual( Year(LoginDate) & '-' & Week(LoginDate), num(Year(LoginDate)) & num(Week(LoginDate), '00' )) as UYearWeek,
dual( Year(LoginDate) & '-' & Month(LoginDate), num(Year(LoginDate)) & num(Month(LoginDate), '00' )) as [UYearMonth],
If(1=1,'App') as UType,
SystemType as USystemTyp,
If(num(weekday(LoginDate))<>6 and num(weekday(LoginDate))<>7,Count("UserID")) as UUniqueUserApp
Group By LoginDate,SystemType;
SQL Select *FROM "myloc_PROD_220".OTSDATA.UserLoginLog;
What am
- « Previous Replies
-
- 1
- 2
- Next Replies »
Accepted Solutions
- Mark as New
- Bookmark
- Subscribe
- Mute
- Subscribe to RSS Feed
- Permalink
- Report Inappropriate Content
Hi Magnus,
sorry, my bad, I had a typo in one of expressions:
Avg(Aggr(Sum(UUniqueUserPortal)+Sum(UUniqueUserApp), UYearMonth))
This should work.
Juraj
- Mark as New
- Bookmark
- Subscribe
- Mute
- Subscribe to RSS Feed
- Permalink
- Report Inappropriate Content
I think you need an aggr() for it, maybe:
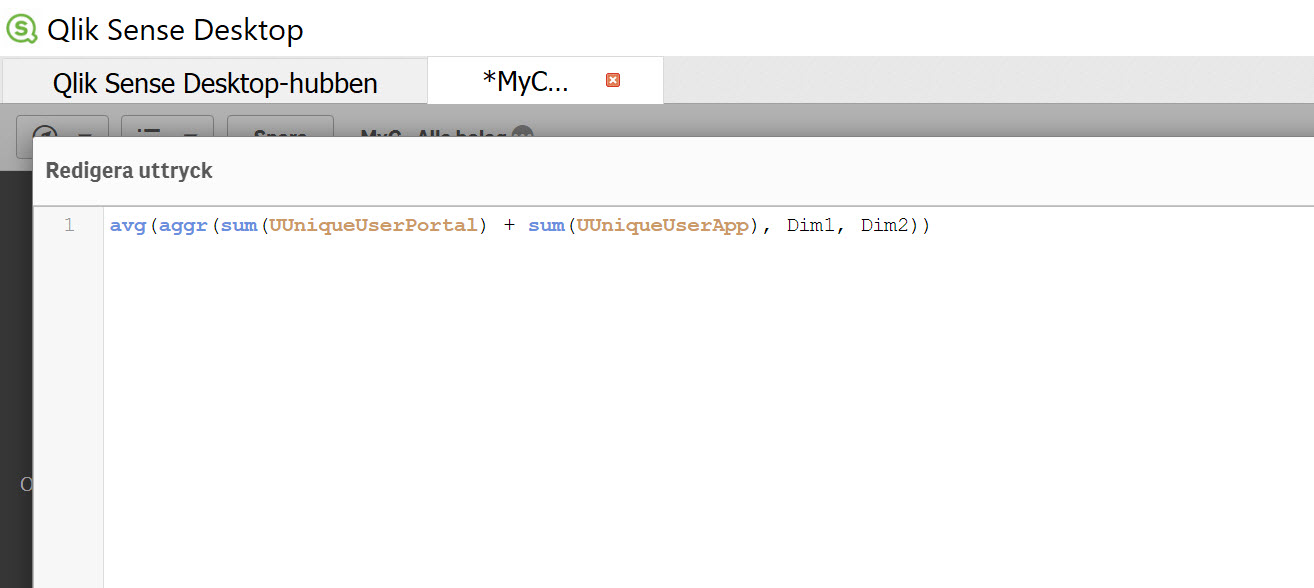
avg(aggr(sum(UUniqueUserPortal) + sum(UUniqueUserApp), Dim1, Dim2))
whereby Dim1 and Dim2 are placeholder for the dimensions in whose context the calculation should be done (usually this are the used dimensions within the chart).
- Marcus
- Mark as New
- Bookmark
- Subscribe
- Mute
- Subscribe to RSS Feed
- Permalink
- Report Inappropriate Content
Hello Marcus,
Thanks a lot for your suggestion but it didn't help, unfortunately.
I used the code in for the expression in frontend:
But I do not get any average value when I run my report.
Any other suggestion or can I modify the sqript somehow?
- Mark as New
- Bookmark
- Subscribe
- Mute
- Subscribe to RSS Feed
- Permalink
- Report Inappropriate Content
May be this:
Avg(Aggr(Sum(UUniqueUserPortal) + Sum(UUniqueUserApp), UUniqueUserPortal, UUniqueUserApp))
Or
RangeAvg(UUniqueUserPortal,UUniqueUserApp)
- Mark as New
- Bookmark
- Subscribe
- Mute
- Subscribe to RSS Feed
- Permalink
- Report Inappropriate Content
Hi,
for this to work correctly you would need to make sure that both UUniqueUserPortal and UUniqueUserApp have values on a single line, like this:
| UYearWeek | UUniqueUserPortal | UUniqueUserApp |
|---|---|---|
| 2018-22 | 1 | 1 |
| 2018-23 | 2 | 1 |
| 2018-24 | 1 | 3 |
I suppose this is not true in your case and you have something like this
| UYearWeek | UUniqueUserPortal | UUniqueUserApp |
|---|---|---|
| 2018-22 | 1 | NULL |
| 2018-22 | NULL | 1 |
| 2018-23 | 2 | NULL |
| 2018-23 | NULL | 1 |
In Qlik Null+1=Null, therefore in your expression Avg(Null+1)=Avg(Null)=Null. You could either adjust your data model by using Join or try using
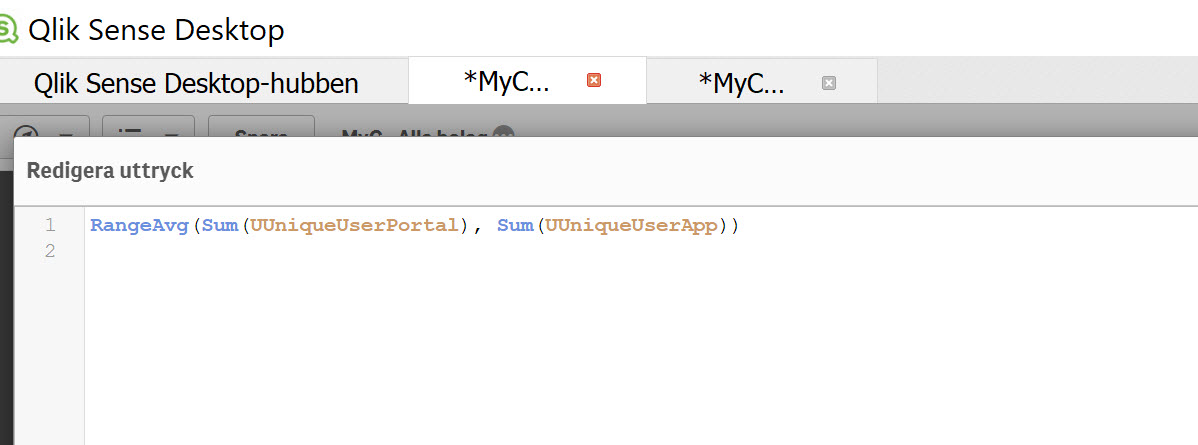
RangeAvg(Sum(UUniqueUserPortal), Sum(UUniqueUserApp))
or
Avg(Aggr(Sum(UUniqueUserPortal), Sum(UUniqueUserApp), UYearWeek))
depending on what you need to achieve.
Hope this helps.
Juraj
- Mark as New
- Bookmark
- Subscribe
- Mute
- Subscribe to RSS Feed
- Permalink
- Report Inappropriate Content
You need to replace the Dim1,Dim2 placeholder with the real fields in which context the calculation should be done.
- Marcus
- Mark as New
- Bookmark
- Subscribe
- Mute
- Subscribe to RSS Feed
- Permalink
- Report Inappropriate Content
Hello Juraj,
Thanks for your help! But I do not really succeed unfortunately...
I've tried to adjust my data by using join and also used the Avg(Aggr(Sum(UUniqueUserPortal), Sum(UUniqueUserApp), ULoginDate)) but I got no results..
When I Use the command RangeAvg(Sum(UUniqueUserPortal), Sum(UUniqueUserApp)) in my expression I've got some figures but that not seems to be the average value I want to see.
I really want to present the average value of number of unique persons per day that logged in to the system. In my case this information is separated in 2 files in the system, cacore.EnvUsersLog for portal users and OTSDATA.UserLoginLog for app users. In my sqript I've done a calculation of nuber of users per day using command Group by LoginDate.
My sqript look like this now:
// User Statistics
LOAD
LoginDate as ULoginDate,
Year(LoginDate) as UYear,
Week(LoginDate) as UWeek,
dual( Year(LoginDate) & '-' & Week(LoginDate), num(Year(LoginDate)) & num(Week(LoginDate), '00' )) as UYearWeek,
If(1=1,'Portal') as UType,
dual( Year(LoginDate) & '-' & Month(LoginDate), num(Year(LoginDate)) & num(Month(LoginDate), '00' )) as UYearMonth,
If(num(weekday(LoginDate))<>6 and num(weekday(LoginDate))<>7,Count(DISTINCT "UserId")) as UUniqueUserPortal
Group By LoginDate;
SQL SELECT *FROM "myloc_PROD_220".cacore.EnvUsersLog;
Join
LOAD
LoginDate as ULoginDate,
Year(LoginDate) as UYear,
Week(LoginDate) as UWeek,
dual( Year(LoginDate) & '-' & Week(LoginDate), num(Year(LoginDate)) & num(Week(LoginDate), '00' )) as UYearWeek,
dual( Year(LoginDate) & '-' & Month(LoginDate), num(Year(LoginDate)) & num(Month(LoginDate), '00' )) as [UYearMonth],
If(1=1,'App') as UType,
SystemType as USystemTyp,
If(num(weekday(LoginDate))<>6 and num(weekday(LoginDate))<>7,Count(DISTINCT "UserID")) as UUniqueUserApp
Group By LoginDate,SystemType;
SQL Select *FROM "myloc_PROD_220".OTSDATA.UserLoginLog;
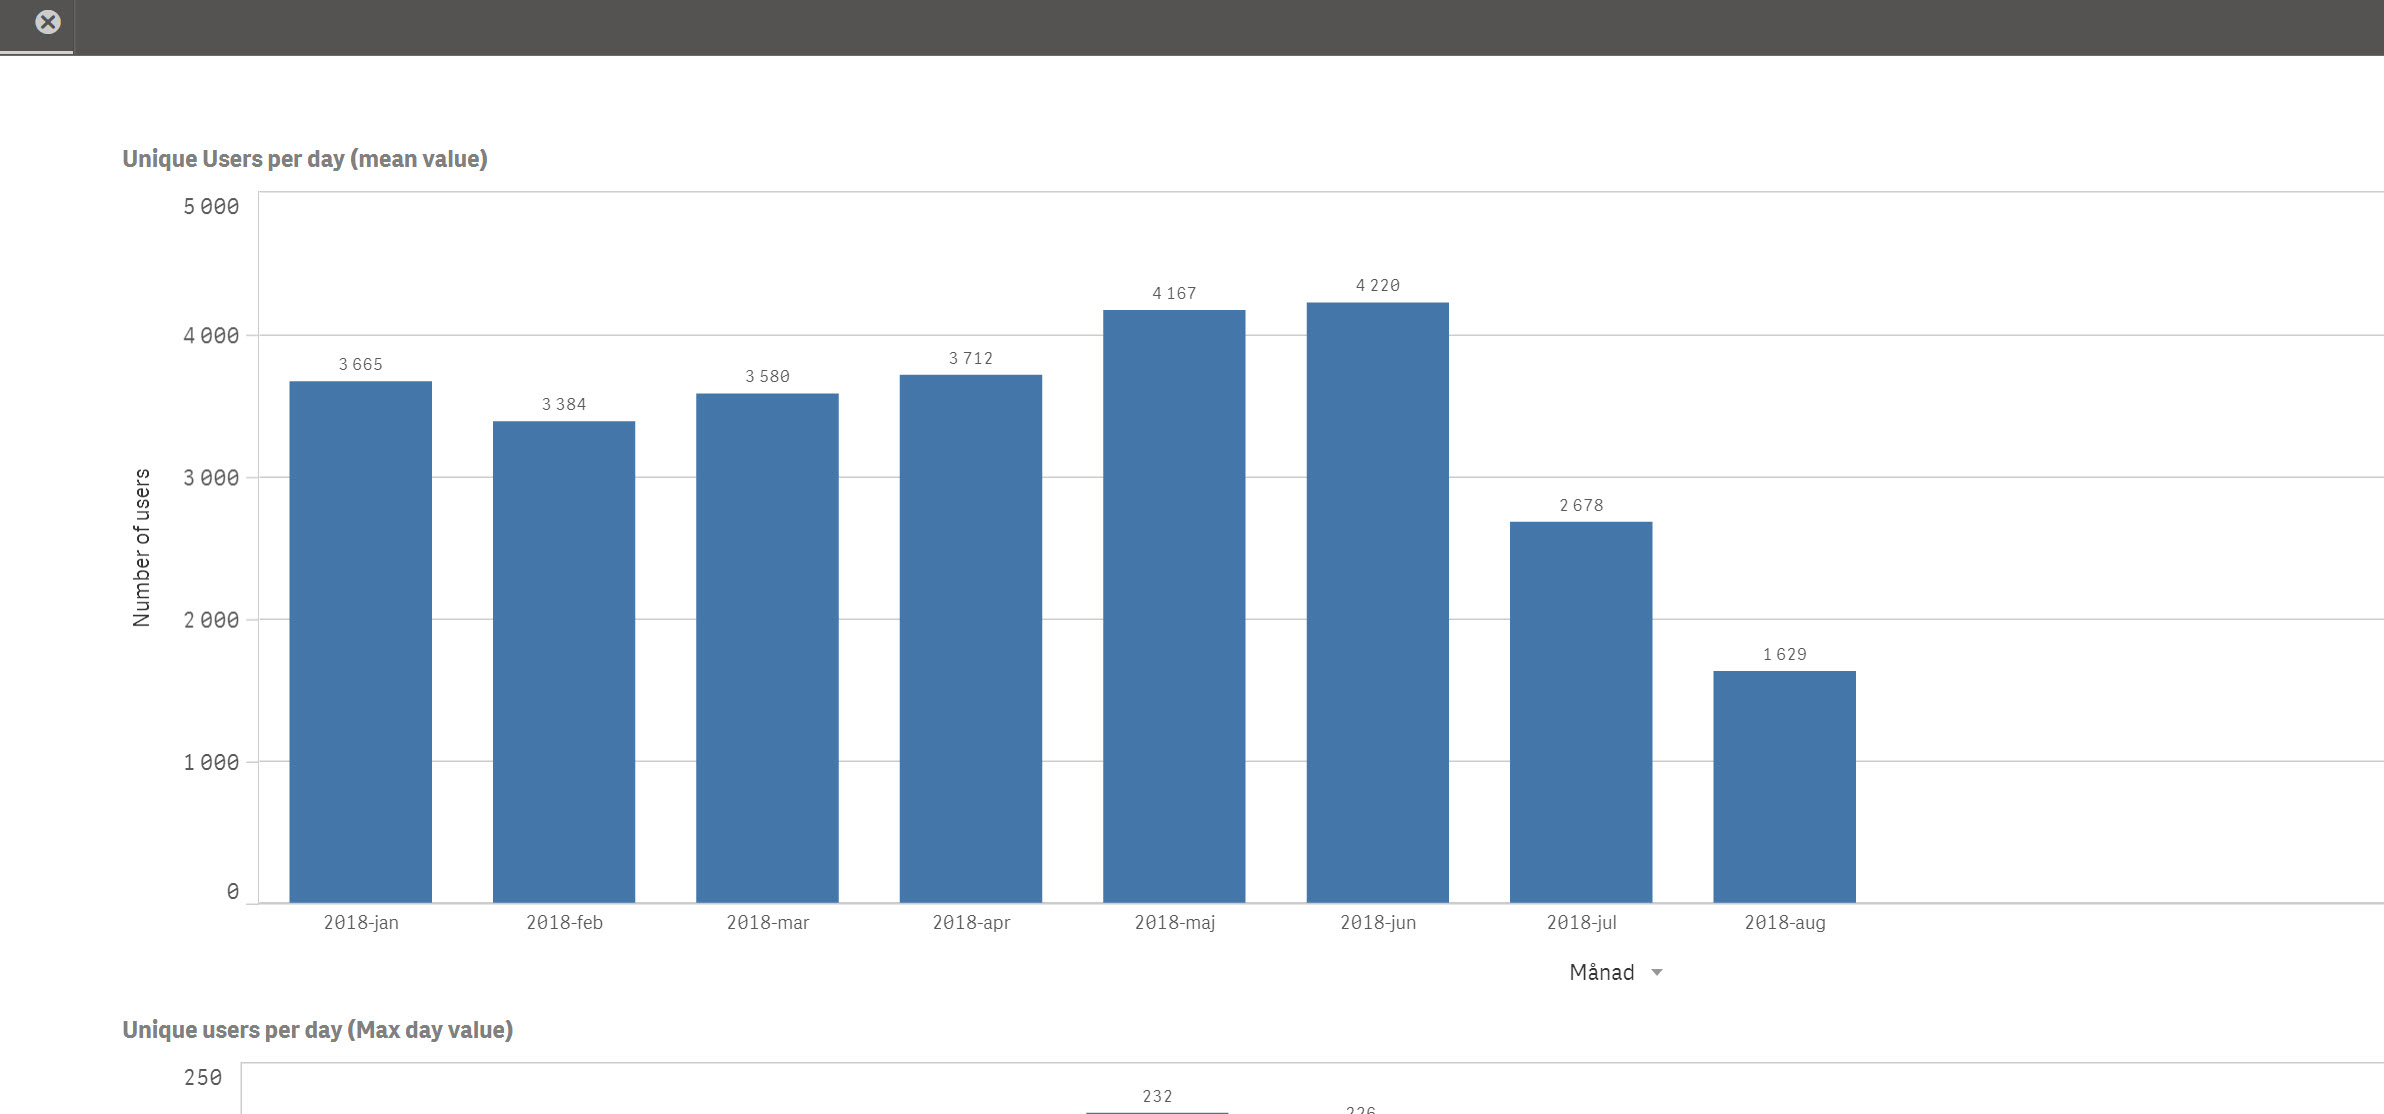
So the problem is what expression should I use in front end to present the mean value of number of users per day during a month. (I also have another graph presenting the maxvalue of users per day during a month). Graphs look like this:
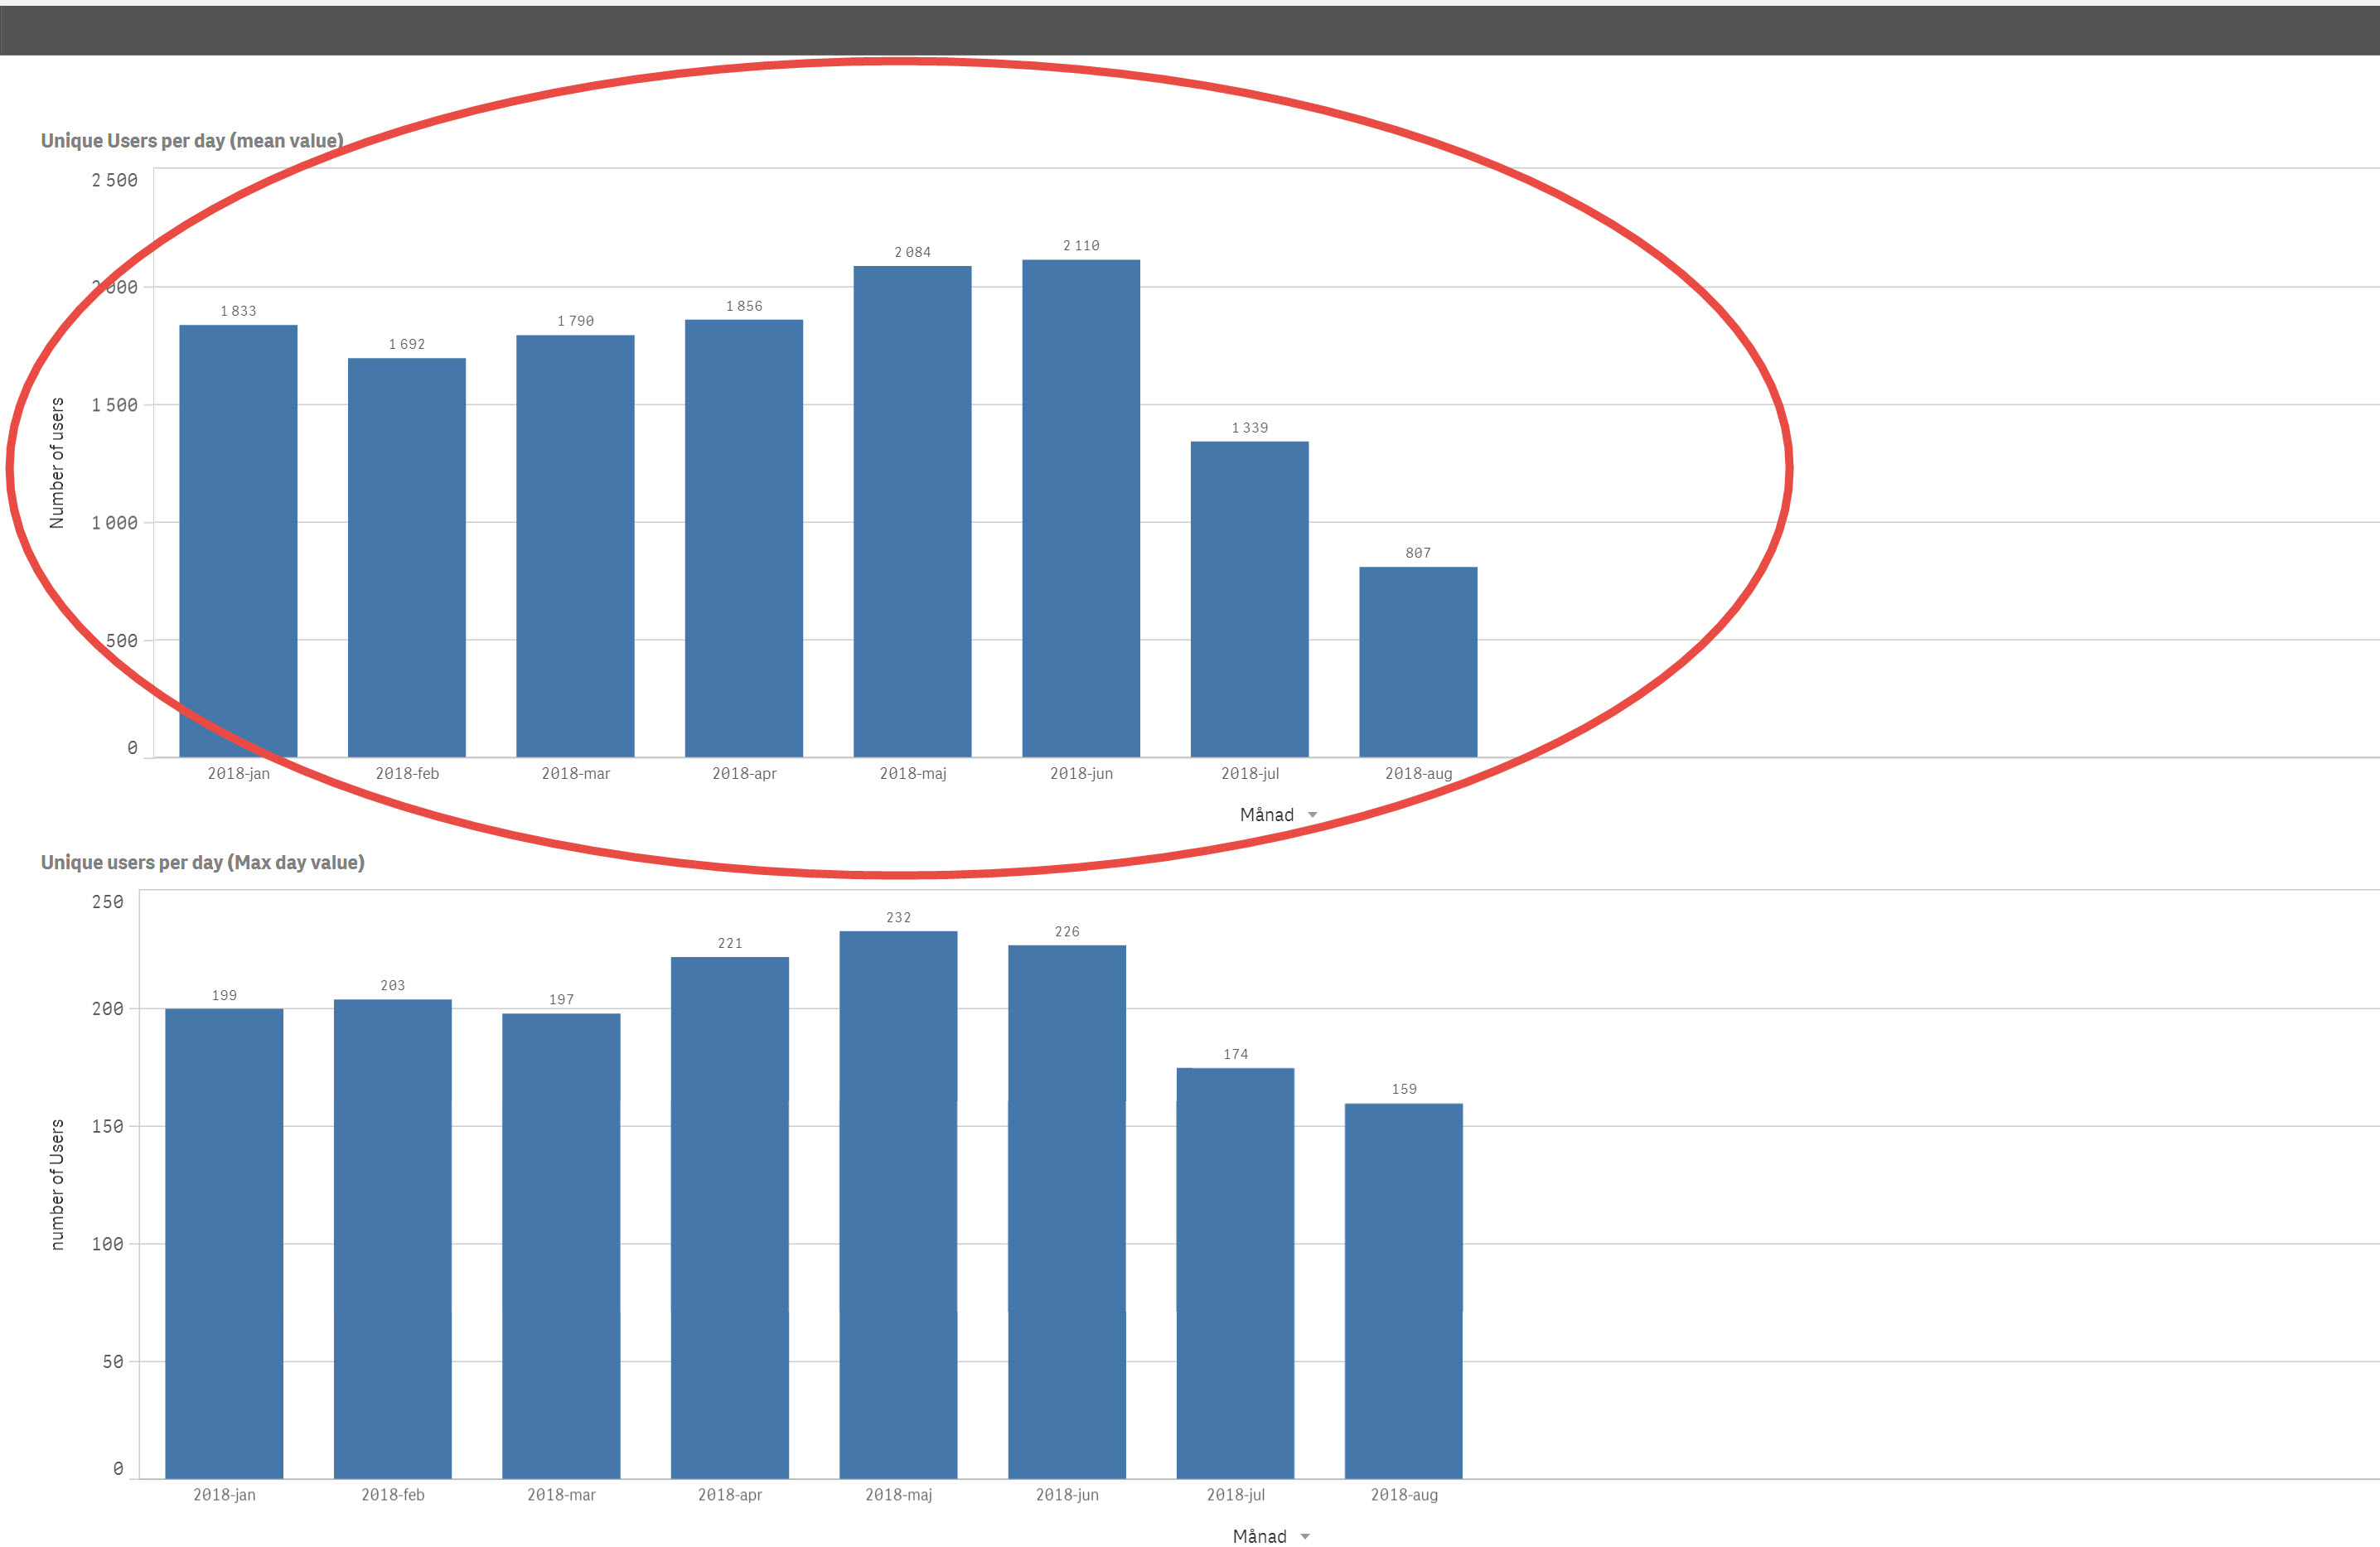
The expression I've tried that gives any result is: RangeAvg(Sum(UUniqueUserPortal), Sum(UUniqueUserApp)) but this is not the correct mean value(see above). Using the Avg(Aggr(Sum(UUniqueUserPortal), Sum(UUniqueUserApp), ULoginDate)) returns no values at all...
So please do you have any other suggestion what expression I should use?
Best regards
// Magnus
- Mark as New
- Bookmark
- Subscribe
- Mute
- Subscribe to RSS Feed
- Permalink
- Report Inappropriate Content
Hi Magnus,
sorry, my bad, I had a typo in one of expressions:
Avg(Aggr(Sum(UUniqueUserPortal)+Sum(UUniqueUserApp), UYearMonth))
This should work.
Juraj
- Mark as New
- Bookmark
- Subscribe
- Mute
- Subscribe to RSS Feed
- Permalink
- Report Inappropriate Content
Your join will act like a concatenate due to different values in he UType field. So the values never align. I do believe that Marcus' design pattern is correct,
avg(aggr(sum(UUniqueUserPortal) + sum(UUniqueUserApp), Dim1, Dim2))
but it is important to have the correct dimensions for the aggr(). What is correct is dependent on the data model and the charts. At a minimum, the dimensions should include the chart's dimension(s).
- Mark as New
- Bookmark
- Subscribe
- Mute
- Subscribe to RSS Feed
- Permalink
- Report Inappropriate Content
Hi Again,
Now I get a value  but it seems not to be an average value per day...... It seems more like a sum for the actual month. The value for august should be about 150-160 unique users but the graph shows 1629.....
Any more ideas?
// Magnus
- « Previous Replies
-
- 1
- 2
- Next Replies »