Unlock a world of possibilities! Login now and discover the exclusive benefits awaiting you.

- Qlik Community
- :
- Forums
- :
- Analytics & AI
- :
- Products & Topics
- :
- App Development
- :
- Visualization problem, chart with dynamic referenc...
- Subscribe to RSS Feed
- Mark Topic as New
- Mark Topic as Read
- Float this Topic for Current User
- Bookmark
- Subscribe
- Mute
- Printer Friendly Page

 andy
andy
- Mark as New
- Bookmark
- Subscribe
- Mute
- Subscribe to RSS Feed
- Permalink
- Report Inappropriate Content
Visualization problem, chart with dynamic reference line
Hi folks,
I've run into trouble while visualizing the planned hours vs. the capacity hours of different resources in a manufacturing site.
(This wasn't possible in Qlikview either but could be solved with two line-charts, one with the capacity line in the background and a transparent area-chart in the foreground with the planned hours per resource)
As dimension I have dates and resources, 2 dimensions makes only 1 measure possible which is the planned hours. How to add the capacity as a reference line.
The reference functionality does not care about the dimensions so it cannot fluctuate with the dates.
I've made a very small app showing the problem.
ANYONE having any idea how one can display a line in an areachart or have another idea to visualize this?

 ErikWetterberg
- Mark as New
- Bookmark
- Subscribe
- Mute
- Subscribe to RSS Feed
- Permalink
- Report Inappropriate Content
Hi,
One possibility is to concatenate your dimensions so you get only one. That makes it possible to have two measures:
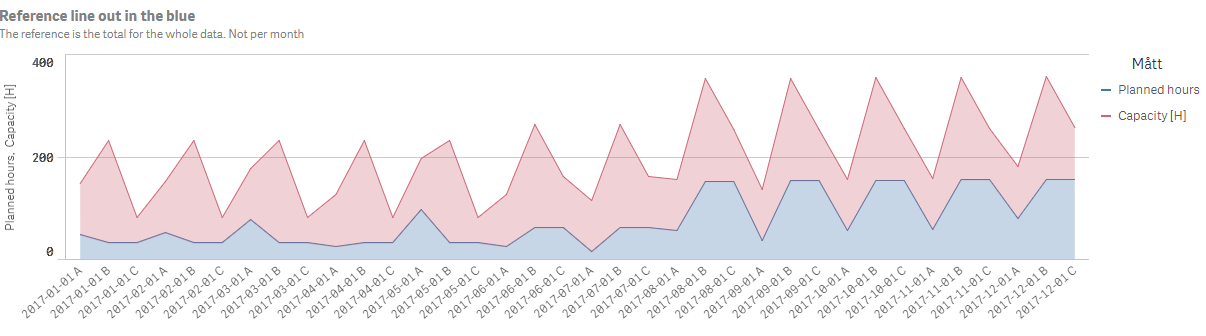
Erik Wetterberg
andy
- Mark as New
- Bookmark
- Subscribe
- Mute
- Subscribe to RSS Feed
- Permalink
- Report Inappropriate Content
Hi,
Thanks for your thought.
In the real case there are more resources and also I would like the chart to be displayed with projects as an alternate dimension to resources and then we talk about 20+ different dimension values which makes this workaround being less appealing.
