Unlock a world of possibilities! Login now and discover the exclusive benefits awaiting you.
Announcements
Q&A with Qlik - Qlik Cloud Migration: Questions about migrating to Qlik Cloud? Catch the latest replay!
- Qlik Community
- :
- Forums
- :
- Analytics & AI
- :
- Products & Topics
- :
- App Development
- :
- Why the gaps in a line chart?
Options
- Subscribe to RSS Feed
- Mark Topic as New
- Mark Topic as Read
- Float this Topic for Current User
- Bookmark
- Subscribe
- Mute
- Printer Friendly Page
Turn on suggestions
Auto-suggest helps you quickly narrow down your search results by suggesting possible matches as you type.
Showing results for
Specialist
2018-10-24
03:52 PM
- Mark as New
- Bookmark
- Subscribe
- Mute
- Subscribe to RSS Feed
- Permalink
- Report Inappropriate Content
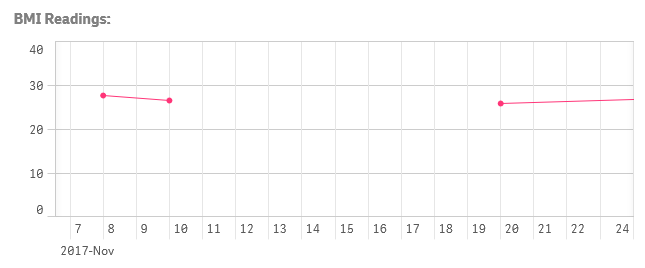
Why the gaps in a line chart?
I have the following line chart with a date dimension. That date exists in a master calendar spanning 2012 to 2018, with a value for every day. I have set Missing values to "Show as gaps" (under Presentation for the chart's Properties).
What I don't understand is why the gaps appear where they do. Why is there NOT a gap on November 9 (a date without data for the measure)? The patient had a BMI reading on November 8th and another one on the 10th. And the next time was on the 20th, so the gap from the 10th to the 20th makes sense.
Does Qlik avoid leaving isolated, disconnected points?
- Tags:
- chart development
996 Views
0 Replies