Unlock a world of possibilities! Login now and discover the exclusive benefits awaiting you.
- Qlik Community
- :
- Forums
- :
- Analytics
- :
- App Development
- :
- X Axis should i use year or quarter ?
- Subscribe to RSS Feed
- Mark Topic as New
- Mark Topic as Read
- Float this Topic for Current User
- Bookmark
- Subscribe
- Mute
- Printer Friendly Page
- Mark as New
- Bookmark
- Subscribe
- Mute
- Subscribe to RSS Feed
- Permalink
- Report Inappropriate Content
X Axis should i use year or quarter ?
Hi All
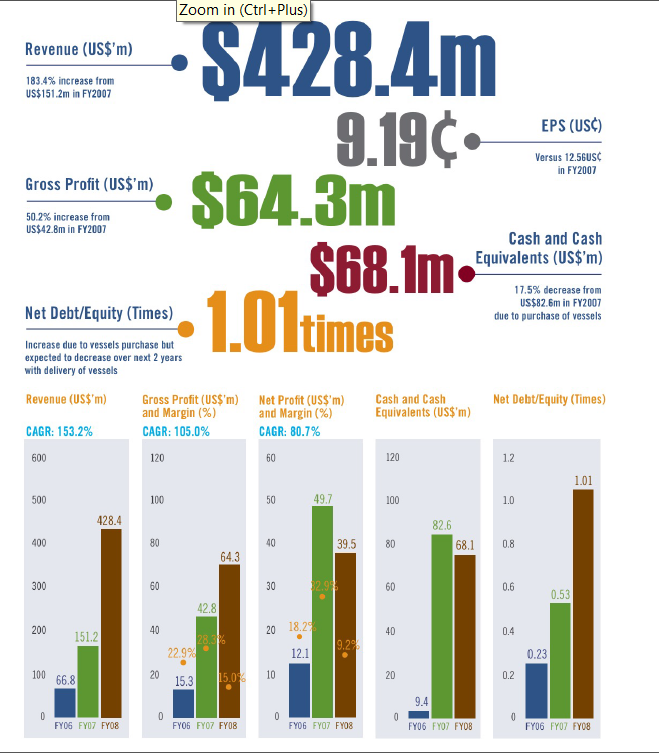
I like to create the below using QS , my issue is for the below image they using Year for X axis .
I try to using year for Axis , but my issue is my sales data is not complete , it only have sales from Jan till 7 Sept.
If i using Year , it is not a fair compare with previous year. as LY have full year sales value and for 2016 only have Jan sales till Sept.
Hope some one can advise me my X Axis should i using Quarter ?
Paul

Accepted Solutions
- Mark as New
- Bookmark
- Subscribe
- Mute
- Subscribe to RSS Feed
- Permalink
- Report Inappropriate Content
Right,
You should use YOY logic to compare same period for all years.
Regards,
Kaushik Solanki
- Mark as New
- Bookmark
- Subscribe
- Mute
- Subscribe to RSS Feed
- Permalink
- Report Inappropriate Content
Hi,
Its a business call, whether you want to see the Year or Quarter.
In Both the cases you may need the Set Analysis in Expression to get correct comparison.
Have a look at the below link for more help.
Set Analysis for certain Point in Time
Regards,
Kaushik Solanki
- Mark as New
- Bookmark
- Subscribe
- Mute
- Subscribe to RSS Feed
- Permalink
- Report Inappropriate Content
Hello Sir
Thank you for sharing the link to me which have very useful SET expression .
Now my issue is on the Bar chart if I use by year is not correct , because the rest of bar is full year .
If I using the month is correct but I unable see the last 3 year trend. Same for quarter.
May be I will using YOY , so that I can compare all bar with same period. That is Jan till Sept.
Paul Yeo
Director
www.tdstech.com<http://www.tdstech.com>
HP+6285883521036 Indo
- Mark as New
- Bookmark
- Subscribe
- Mute
- Subscribe to RSS Feed
- Permalink
- Report Inappropriate Content
Right,
You should use YOY logic to compare same period for all years.
Regards,
Kaushik Solanki