Unlock a world of possibilities! Login now and discover the exclusive benefits awaiting you.
- Qlik Community
- :
- Forums
- :
- Analytics & AI
- :
- Products & Topics
- :
- App Development
- :
- Re: color banding on multiple rows (using rank() ?...
- Subscribe to RSS Feed
- Mark Topic as New
- Mark Topic as Read
- Float this Topic for Current User
- Bookmark
- Subscribe
- Mute
- Printer Friendly Page
- Mark as New
- Bookmark
- Subscribe
- Mute
- Subscribe to RSS Feed
- Permalink
- Report Inappropriate Content
color banding on multiple rows (using rank() ?)
This seems like this should be easy but I cannot get this to work. I want to alternate colors for rows of a table but the rows will be in groups of variable size. I thought that I could use the rank function to denote the groups and then flag the rank as even or odd to control the color banding, but this is not working for me for some reason. Here is some sample data:
Load * Inline [
Pt, Date, Product, Order
123, 1/1/2017, Apples, Order1
123, 1/1/2017, Pears, Order1
123, 1/1/2017, Oranges, Order2
123, 2/1/2017, Apples, Order3
123, 2/1/2017, Oranges, Order4
123, 2/1/2017, Bananas, Order5
123, 3/3/2017, Bananas, Order6
123, 3/3/2017, Pears, Order7
123, 3/3/2017, Apples, Order8
];
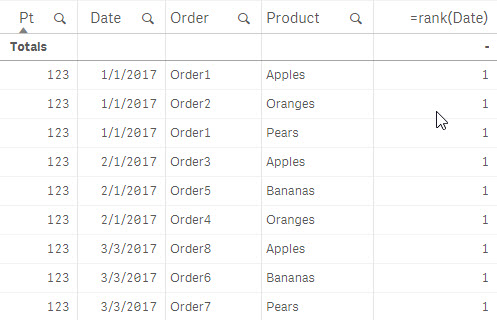
Here is what I am getting, The column Pt is first in the sort order...I know the rank function depends on sort order.

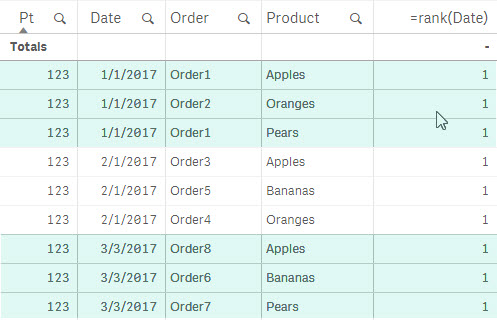
What I am after is this...

Thanks in advance for any help. Feel free to suggest an easier way to do this.
- « Previous Replies
-
- 1
- 2
- Next Replies »
- Mark as New
- Bookmark
- Subscribe
- Mute
- Subscribe to RSS Feed
- Permalink
- Report Inappropriate Content
This method works if the data displayed in the chart are the complete contents of the loaded table. However, the data in the table I want to display is the result of selections in the app and so this solution could also produce consecutive colored bands.
- Mark as New
- Bookmark
- Subscribe
- Mute
- Subscribe to RSS Feed
- Permalink
- Report Inappropriate Content
have you seen my solution?
- Mark as New
- Bookmark
- Subscribe
- Mute
- Subscribe to RSS Feed
- Permalink
- Report Inappropriate Content
Yes, I looked at it. It depends on the assumption that consecutive dates in the chart are even/odd which is not a good assumption. It is entirely possible that the selections made by the user will include all even days or all odd dates or random occurrences of either.
- « Previous Replies
-
- 1
- 2
- Next Replies »