Unlock a world of possibilities! Login now and discover the exclusive benefits awaiting you.
- Qlik Community
- :
- Blogs
- :
- Technical
- :
- Design
- :
- AGGR...
- Subscribe to RSS Feed
- Mark as New
- Mark as Read
- Bookmark
- Subscribe
- Printer Friendly Page
- Report Inappropriate Content
The AGGR Function.....
I thought I would start this blog post with a simple multiple choice question:
Is AGGR.....
a - Used in many QlikView applications to great effect
b - Mis-used in many QlikView applications
c - Used to return an answer without really knowing why you get the answer
d - Not used at all because we're "not quite sure what is does"
e - All of the above
The answer in my opinion is "e - All of the above".
When I came to write this post and indeed the technical brief, the hardest part of all was actually coming up with a really good, easy to understand description of AGGR, as it has to make sense to both "technical" and "not so technical" people. I finally settled on the one below...
When it is used, the AGGR function produces a virtual table, with one expression and grouped by one or more dimensions. The contents / result of this virtual table can then be used / aggregated by a further outer aggregation function(s).
With this definition in mind, I have produced a Technical Brief and application which can be found here and here. In this document I have tried to provide an overview of the function and provided some examples of where it can be used to great effect.
So, when should you use AGGR? The answer is: Whenever you want to perform an aggregation in two steps. In the technical brief we show you some scenarios like.....
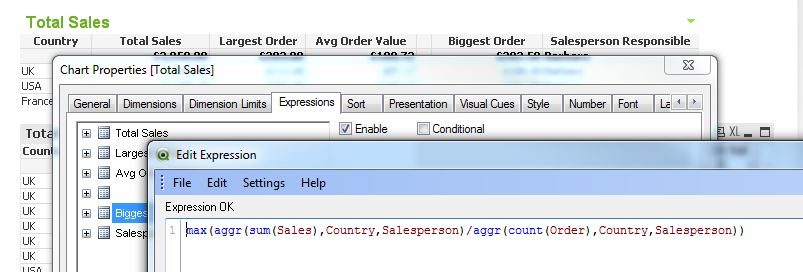
- Largest average order value for each Salesperson for each Country, where average order value for each Salesperson is the first calculation and the largest in each Country is the second.
- The Salesperson responsible for the largest average order value in each Country
- How many Salespeople have average order values of less than $100 in each Country
I would also be interested in any other creative and powerful uses of AGGR you may have.
Thanks.
ABY
- « Previous
-
- 1
- 2
- Next »
You must be a registered user to add a comment. If you've already registered, sign in. Otherwise, register and sign in.