Unlock a world of possibilities! Login now and discover the exclusive benefits awaiting you.
- Qlik Community
- :
- Blogs
- :
- Technical
- :
- Design
- :
- How IntervalMatch Solved My Profit and Loss Dilemm...
- Subscribe to RSS Feed
- Mark as New
- Mark as Read
- Bookmark
- Subscribe
- Printer Friendly Page
- Report Inappropriate Content
Of the 2 ½ years I have been with QlikTech, I have never had to use the IntervalMatch prefix in any of my scripts but I recently found out how powerful it can be. I was tasked with creating a Profit and Loss (P&L) statement in QlikView based on the format outlined in this Excel file.
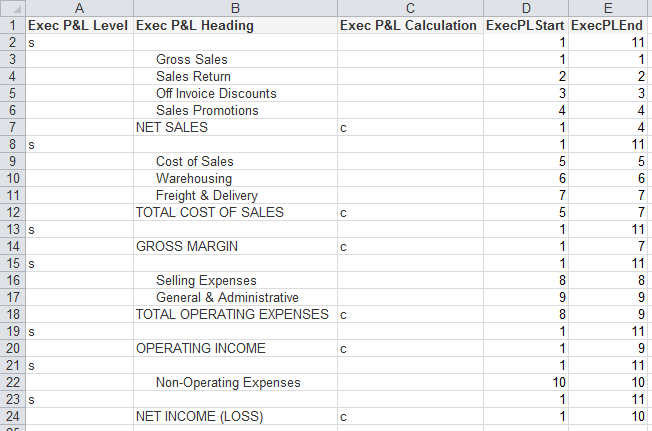
- The “s” in the Exec P&L Level column indicates blank rows
- The “c” in the Exec P&L Calculation column indicates rows where a calculation needs to be performed
- The Exec P&L Heading column stores the headings that are to be used in the P&L statement
- The ExecPLStart and ExecPLEnd columns indicate the range of rows that are to be summed
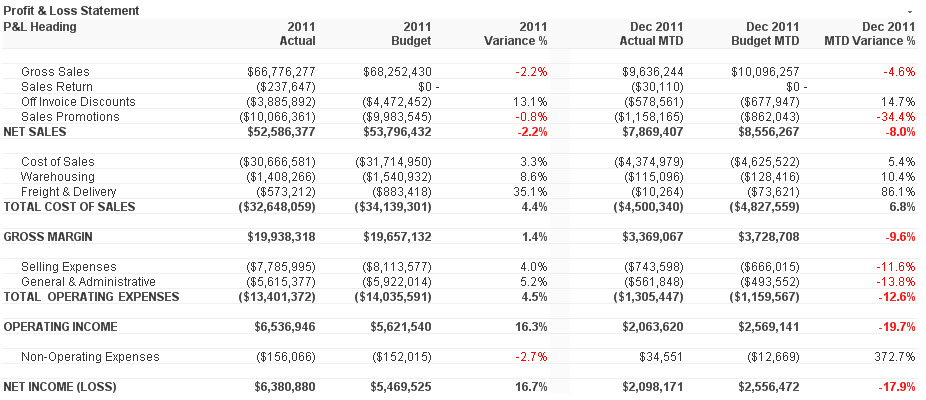
Who would have thought something as simple as IntervalMatch would solve my problem? I have always said that I learn something new about QlikView every day and this day was no different. I was able to load my master account information, my account balance information and then perform the IntervalMatch, using the reporting code field from the master account table, to get everything in sync so that the correct rows were summed in the P&L statement. Then all I needed to do was create my chart (a straight table) in QlikView. In the end my chart looked like the image below and I was quite pleased.
I wrote a technical brief about how I completed this task. I know this is just one of the many ways IntervalMatch can be used. I am sure in the future I will learn some of the other ways.
You must be a registered user to add a comment. If you've already registered, sign in. Otherwise, register and sign in.