Do not input private or sensitive data. View Qlik Privacy & Cookie Policy.
Skip to main content

Announcements
Data Works for AI is here - Join the discussion and enter to win a pair of Qlik kicks: Join the Conversation!
Jennell_Yorkman
Employee
Employee

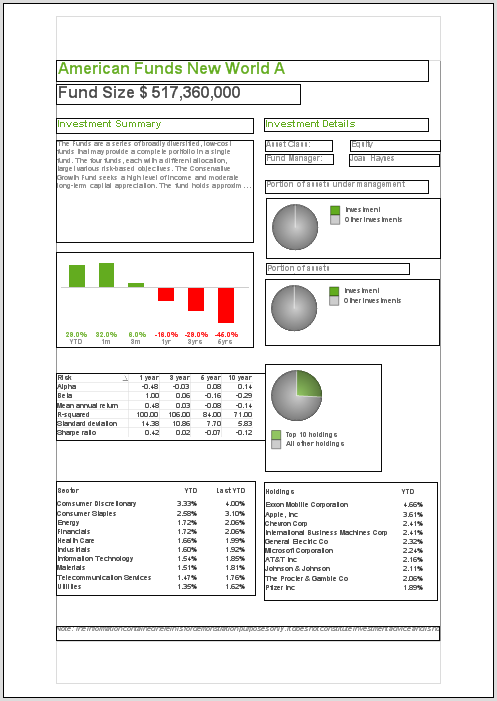
The visualizations and charts in QlikView are dynamic and always changing based on the user’s selections and interactions with the data.  That being said I rarely find the need to print the visualizations and take them with me because I know that the data may be refreshed thus changing the visualizations and charts.  But sometimes there is a need for the user to be able to print a static report of what they see in QlikView to share with someone or refer to at a later time. QlikView’s Report Editor provides users with an easy way to capture the QlikView objects in a formatted report that can printed.  Reports can be created by simply dragging objects from the user interface to the report sheet.
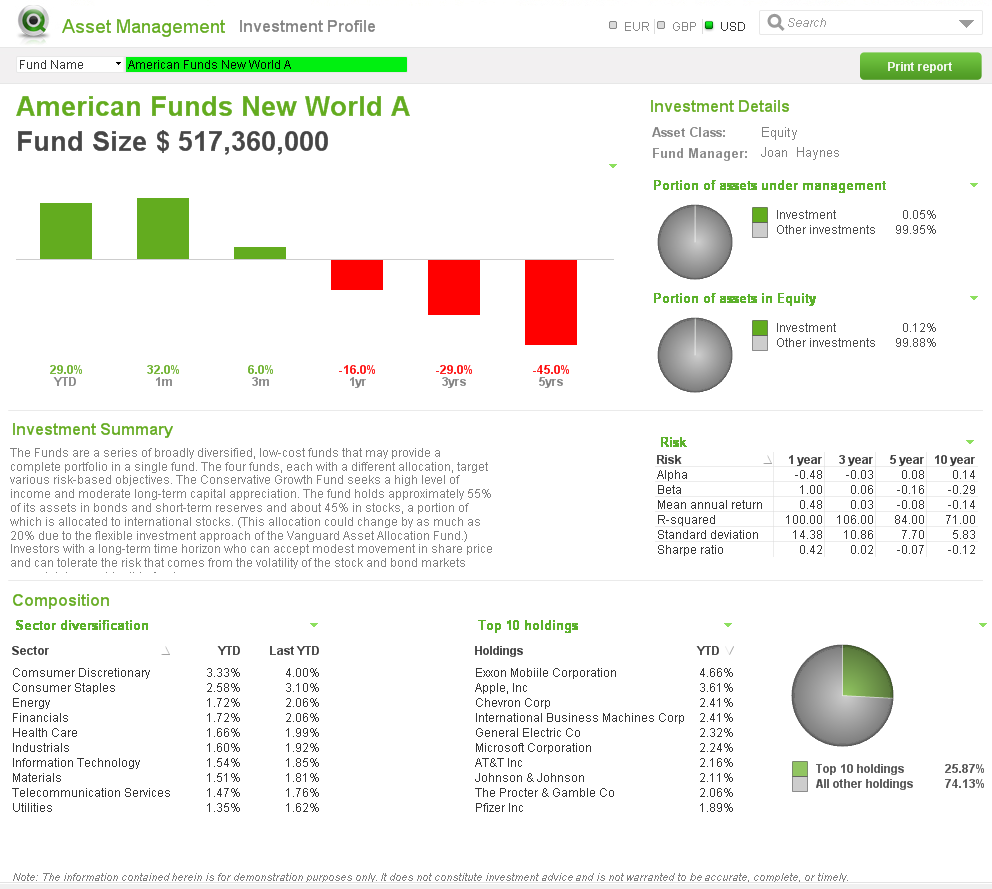

user interface.pngarrow.pngreport sheet.png
User InterfaceReport sheet


Simply drag the object from the user interface and place them anywhere on the report.  Objects can be moved and resized in the report and arranged as you see fit.  When I need to add objects to the report that are not a part of the user interface such as an image for the cover sheet or a logo, I will add the object to a hidden sheet in QlikView and format it as I would like it to appear in the report. Then I can drag it to the report. There is also the ability to add an image, text object or current selection box directly from the Report Editor if you prefer.  In either case, static reports that are nicely formatted can be created in QlikView for users who prefer to have a printout of their visual QlikView experience.

Check out this technical brief for step-by-step details of how the reports were added to the Asset Management demo using the Report Editor.

Jennell

48 Comments
pablolabbe
Partner Ambassador
Partner Ambassador

As I know Qlikview reports doesn´t support hypelinks. This is why it doesn´t work.

0 Likes
614 Views
nagarajupinnibo
Creator
Creator

Hi,

I had a bar chart which contains 20 records for the dimension. For this, I used drop down for the dimension in chart.

I drag it to Edit report for Printing,

Chart showing only first 6 values in chart. Iam unable to print remaining 14 dimension values.

Even I used Multi page also, Iam not able to see remaining values.

Does anyone faced this problem??

0 Likes
614 Views
ThornOfCrowns
Specialist II
Specialist II

Thanks for the aticle, though it doesn't mitigate my approach to reporting in Qlikview, i.e. with a whip and a chair. It's second only to Crystal Reports for its 'quirks', IMHO.

Nagaraju Pinniboina You may get a better response by posting yuor question as a new question, rather than in a thread comment, if you havn't already done so.

0 Likes
614 Views
stevedark
Partner Ambassador/MVP

My thoughts and a quick tutorial on QlikView Reports can be found here:

http://www.quickintelligence.co.uk/qlikview-reports/

Steve

0 Likes
614 Views
Not applicable

Hi

Is that can used in Qlik Sense?

0 Likes
614 Views
stevedark
Partner Ambassador/MVP

Hi,

The old reports tool is (thankfully) not in Qlik Sense.  Your best bet is to create a Story and then export the story.

Hopefully now that Qlik own NPrinting there will be NPrinting for Sense at some point - but I've not seen this on any road map.

For now there are just elements of what NPrinting can do incorporated into Sense.

Steve

0 Likes
614 Views
Jason_Michaelides
Partner - Master II
Partner - Master II

Hi Steve,

I think the Qlik update we were shown at Monday's Dev Group event said NPrinting for Sense was due towards the end of this year.

Cheers,

Jason

603 Views
stevedark
Partner Ambassador/MVP

I must have been having beer or pizza, or both, at that point. 

That will be good to see, and the fact that NPrinting is going to have a nice shiny web interface from the middle of the month it fits perfectly alongside Sense.

Thanks for hosting another cracking Dev Group session, by the way.

Steve

0 Likes
603 Views
DavidFoster1
Specialist
Specialist

Did you notice though that the focus was heavily on the on-demand side rather than the report generator side that everyone uses.

0 Likes
603 Views
Not applicable

Hi Steve,

But the story have the limitation functions such cannot save the sheet in the PPT which means when i export the story to PPT, the embedded sheet cannot be exported.

0 Likes
603 Views