Unlock a world of possibilities! Login now and discover the exclusive benefits awaiting you.
- Qlik Community
- :
- Blogs
- :
- Technical
- :
- Design
- :
- picasso.js and hypercubes
- Subscribe to RSS Feed
- Mark as New
- Mark as Read
- Bookmark
- Subscribe
- Printer Friendly Page
- Report Inappropriate Content
If you want to use data from a hypercube to create a chart with picasso.js you're probably going to want to use the picasso.js q plugin. The q plugin makes it easy to extract data from a hypercube for use with picasso.js. In this post I'm going to go through the steps needed to use the q plugin for picasso.js to show you how to use hypercube data to create a chart with picasso.js, and also go over updating the chart when the hypercube data changes, and making selections in the QIX Engine from a picasso.js chart.
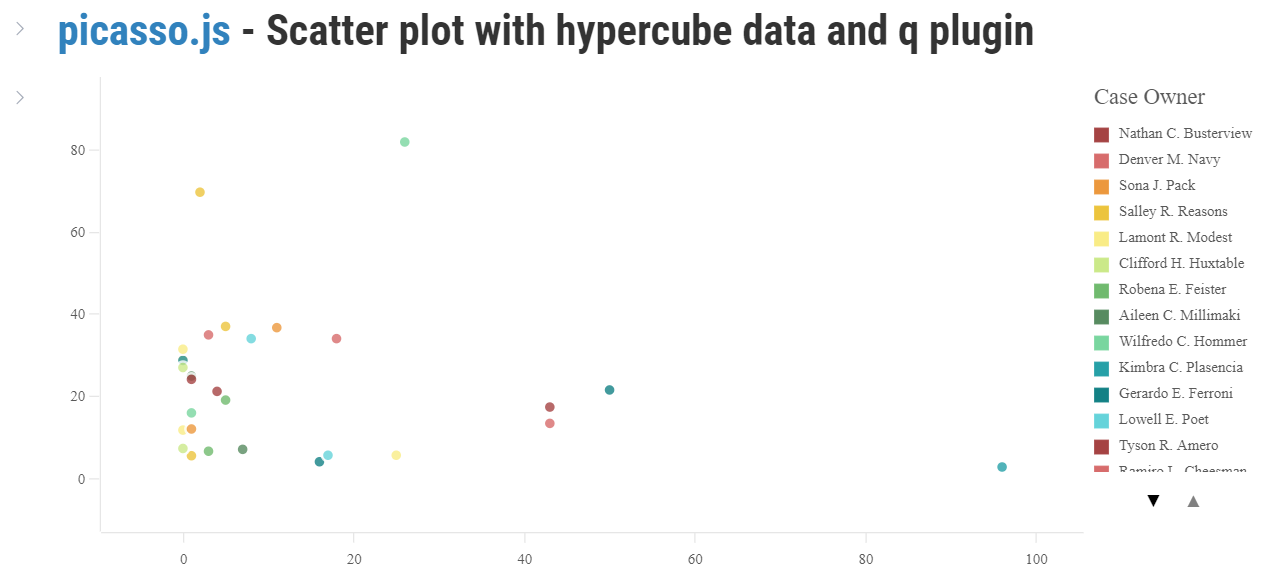
Check out this observable notebook of creating a scatter plot with hypercube data and the q plugin
Setup picasso.js
You'll need to install picasso and picassoQ, and register picassoQ with picasso. You can install them with npm install --save picasso.js picasso-plugin-q, and then register picassoQ with picasso like below.
import picasso from 'picasso.js';
import picassoQ from 'picasso-plugin-q';
picasso.use(picassoQ); // this registers the picasso q plugin with picasso.js
Create and update picasso.js chart with hypercube data
You'll need a hypercube of course. I'm going to assume here that you know how to create a hypercube with the App API or enigma.js, and if not, there's other resources for learning how to do that, so we won't cover it again here. Below is a general pattern for creating and updating a picasso.js chart after creating a hypercube with enigma.js
(async () => {
const hypercube = await qDoc.createSessionObject(/* hypercube def */);
const layout = await hypercube.getLayout();
createPic(layout); // function that calls chart method on a picasso instance
hypercube.on('changed', async () => { // listen for updates to hypercube
const newLayout = await hypercube.getLayout(); // get new layout
updatePic(newLayout); // function that calls update method on a picasso instance
})
})()
.
In the above block, we create a hypercube, get the layout, and call a function we define that calls the chart method on an instance of picasso.js. Then we watch for the hypercube to update, and can use the update method of picasso.js to simply update the data for the chart. The createPic and updatePic functions might look something like this.
let chart;
const createPic = (layout) => {
chart = picasso().chart({
element: document.querySelector('#container'), // some DOM element
data: [{
type: 'q', // this tells picasso the data is from a hypercube
key: 'qHyperCube', // path to the hypercube from the layout,
data: layout.qHyperCube
}],
settings: {} // the chart settings (scales, components, etc.)
});
}
const updatePic = (layout) => {
chart.update({ // we just need to update the data
data: [{
type: 'q',
key: 'qHyperCube',
data: layout.qHyperCube
}]
});
}
Making selections in the QIX engine
The picasso q plugin has helper functions for generating methods to make QIX selections from a picasso.js brush. You just get a reference to the brush using the brush method of picasso, then use the selections method of picassoQ to generate the QIX methods, then apply them to your QIX model. It would look something like this.
const brush = chart.brush('name-of-brush'); // get reference to brush
const selection = picassoQ.selections(brush)[0]; // generate selection method
qDoc[selection.method](...selection.params); // apply selection method to model
And that's it. You can check out the observable notebook I created for this blog post, and the picasso-plugin-q too.
You must be a registered user to add a comment. If you've already registered, sign in. Otherwise, register and sign in.