Unlock a world of possibilities! Login now and discover the exclusive benefits awaiting you.
- Qlik Community
- :
- Forums
- :
- Groups
- :
- Location and Language
- :
- Español
- :
- Problema Analisis Conjunto Grafico
- Subscribe to RSS Feed
- Mark Topic as New
- Mark Topic as Read
- Float this Topic for Current User
- Bookmark
- Subscribe
- Mute
- Printer Friendly Page
- Feature this Topic
- Mark as New
- Bookmark
- Subscribe
- Mute
- Subscribe to RSS Feed
- Permalink
- Report Inappropriate Content
Problema Analisis Conjunto Grafico
Buenas tardes:
Precisaria la ayuda de un experto ya que soy nuevo en QV.
He diseñado un grafico con la expresion siguiente:
Sum (Cant) / Count ({1<CAUS={"A"}>} CAUS)
En el tengo como dimension CAUS con tres tipos de valores: A, B y C.
La segunda parte de la funcion si funciona bien, ya que me da 84 si selecciono A, B o C que es lo que quiero.
El problema es el Sum (Cant) que solo calcula el sumatorio de las cantidades de A. Dejando sin datos cuando selecciono solo B o C.
¿Se puede modificar el Sum para hacerlo independiente de la segunda parte de la funcion?
Gracias de antemano.
- Tags:
- Group_Discussions
- « Previous Replies
-
- 1
- 2
- Next Replies »
Accepted Solutions
- Mark as New
- Bookmark
- Subscribe
- Mute
- Subscribe to RSS Feed
- Permalink
- Report Inappropriate Content
Perdón. probá con esta:
=SUM(cant)/ Count({1<caus={'A'}>} TOTAL <mes> caus)
Como consejo, para la próxima tratá de mandar una aplicación reducida, al menos. A muchos nos da fiaca ponerse a hacer una aplicación para probar los resultados.
Aguante Messi!!
- Mark as New
- Bookmark
- Subscribe
- Mute
- Subscribe to RSS Feed
- Permalink
- Report Inappropriate Content
Hello:
I need the help of one expert, because I am new in QV.
I have designed a chart with the expression:
Sum (Cant) / Count ({1<CAUS={"A"}>} CAUS)
In this I have as dimension CAUS with three diferent values: A, B and C.
The second part of the expression works correctly, becuase the result give me 84 when I selected A, B or C, that it is what I want.
The problem is the Sum (Cant) wich only calculate the summa of the quantities of A. Giving me not data when I selected only B o C.
Is it possible modify the Suma to be independent of the second part of the function?
Many thanks,
- Mark as New
- Bookmark
- Subscribe
- Mute
- Subscribe to RSS Feed
- Permalink
- Report Inappropriate Content
HI
What you want , can you say in detail..
From my understanding, you want all values in sum() , if so,
=sum(total cant)
or, if you want to exclude the 'A'
=sum({<CAUS-={'A'}>}Cant)
Please close the thread by marking correct answer & give likes if you like the post.
- Mark as New
- Bookmark
- Subscribe
- Mute
- Subscribe to RSS Feed
- Permalink
- Report Inappropriate Content
Hi Mayil:
Thanks for your answer.
The problem is the second part of the expession. That fix as dimension in the chart as A, when I selected B or C in a table vinculated only appears A as dimension in the chart.
What I want, per example:
A B C
Count 84 10 20
Suma 100 200 300
I hope in the chart three parts in each bar: A, B and C with the following values:
If I selected A in the table: 100/84
if I selected B in the table: 200/84
If I selected C in the table: 300/84
If I selected A y B in the table: 100/84 in the bottom of the bar and 200/84 at the top of the bar........
I tried your suggestion and does´nt work in this way.
Thanks in advance.
- Mark as New
- Bookmark
- Subscribe
- Mute
- Subscribe to RSS Feed
- Permalink
- Report Inappropriate Content
Hi
Try like this,
Sum (Cant) / Count (<CAUS> CAUS)
Hope it helps
Please close the thread by marking correct answer & give likes if you like the post.
- Mark as New
- Bookmark
- Subscribe
- Mute
- Subscribe to RSS Feed
- Permalink
- Report Inappropriate Content
Hola Inigo,
Quizás no sea un experto, pero es más cómodo en castellano!!
Quizás sea más útil que pases la aplicación para verlo mejor, pero voy pasar en limpio lo que comprendí. Tenés un gráfico (supongamos de tabla simple), con la dimensión CAUS y la expresión Sum(Cant)/Count({1<CAUS={"A"}>} CAUS).
Si separamos las expresiones en dos, sin seleccionar nada, esa nueva tabla te debería mostrar:
CAUS Sum(Cant) Count({1<CAUS={"A"}>} CAUS)
A 100 84
B 200 84
C 300 84
Si esa tabla te da igual, significa que no hay problemas de asociación de datos. Si no te da igual, pasala por favor (la aplicación reducida o la imagen de tabla)
Vos decís que si agregás una tercera columna con Sum(Cant)/Count({1<CAUS={"A"}>} CAUS) te queda algo así?
CAUS Sum(Cant)/Count({1<CAUS={"A"}>} CAUS)
A 84/100
B -
C -
- Mark as New
- Bookmark
- Subscribe
- Mute
- Subscribe to RSS Feed
- Permalink
- Report Inappropriate Content
Hola Sebastian:
Asi es la segunda parte de la expresion fija A en el grafico.
Cuando selecciono en la tabla anexa A+B+C; solo aparece 100/84.
Si selecciono B o C, no existen datos.
Para que lo entiendas el ejemplo tiene que ver con las mermas de bobinas:
A es la de inicio de bobina, B es la merma interna y C las de la parte externa de la bobina.
Quiero calcular el ratio por bobina, pero todas las bobinas tienen A y C, pero no todas tienen B. Por lo que la funcion AVG funciona bien con A y C, pero el ratio de la B es exagerado al no tener todas las bobinas mermas internas.
Esta es la razon por la que quiero calcular todas ellas mediante el COUNT de A, que me da el numero de bobinas consumidos.
Si tienes alguna solucion te lo agradecere.
- Mark as New
- Bookmark
- Subscribe
- Mute
- Subscribe to RSS Feed
- Permalink
- Report Inappropriate Content
Pero no entiendo por qué la dimensión es CAUS?
Te pido que me envíes una copia reducida, porque estoy medio lento para entender.
- Mark as New
- Bookmark
- Subscribe
- Mute
- Subscribe to RSS Feed
- Permalink
- Report Inappropriate Content
Hola Sebastian:
Te envio unos screen de las tablas que me aparecen, realizada con los siguientes datos:
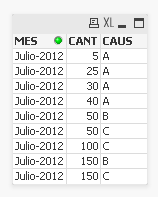
El resultado que quiero es una tabla apilada con los datos:
A= 100/4=25
B=200/4=50
C=300/4=75
Saludos,
- « Previous Replies
-
- 1
- 2
- Next Replies »