Unlock a world of possibilities! Login now and discover the exclusive benefits awaiting you.
- Qlik Community
- :
- Discover
- :
- Programs
- :
- Qlik Gallery
- :
- Qlik Gallery
- :
- Self Service Analytics Template
- Subscribe to RSS Feed
- Mark as New
- Mark as Read
- Bookmark
- Subscribe
- Printer Friendly Page
- Report Inappropriate Content


Discoveries
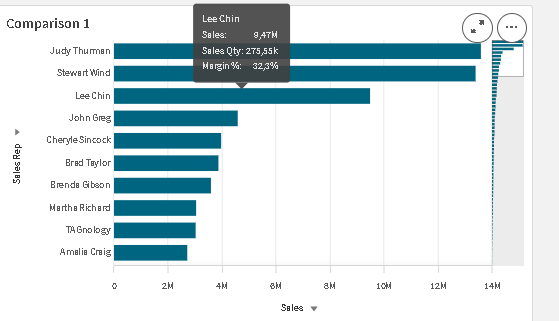
The main metrics should be displayed as KPI objects and the other metrics can be analyzed as alternative measures in the charts. The 2 bar charts provide users with the ability to compare metrics and freely explore the data selecting an alternative dimension. The botton line chart allow user to see trends of each metric along the time.
Impact
We have applied this template to rapidly release the locked data and let Business Users explore and validate the data even before building a dashboard.
Audience
All users that need to engage with analytics for the first time with a simplest interface.
Data and advanced analytics
This template can be improved with forecasting analysis and trend lines. Any data can be analyzed using this template.
You must be a registered user to add a comment. If you've already registered, sign in. Otherwise, register and sign in.