Unlock a world of possibilities! Login now and discover the exclusive benefits awaiting you.
- Qlik Community
- :
- Forums
- :
- Groups
- :
- Industry and Topics
- :
- Healthcare
- :
- Re: Avoiding a Data Tornado
- Subscribe to RSS Feed
- Mark Topic as New
- Mark Topic as Read
- Float this Topic for Current User
- Bookmark
- Subscribe
- Mute
- Printer Friendly Page
- Feature this Topic
- Mark as New
- Bookmark
- Subscribe
- Mute
- Subscribe to RSS Feed
- Permalink
- Report Inappropriate Content
Avoiding a Data Tornado
 You know I love to go out on a limb using data metaphors. Sometimes they are my own and sometimes I flat out steal them from others. (Imitation is the sincerest form of flattery you know.) I’ve wanted to continue my series on The Data Consumption Continuum for a few weeks now. But just writing my thoughts? That’s crazy. I’ve had to show great patience in waiting for just the right metaphor to come along to catch your attention and draw you in. The “what in the world is Qlik Dork up to now” kind of lead. Recently inspiration struck as I came across this beautiful data metaphor “Data Tornado” from Tyler Bell.
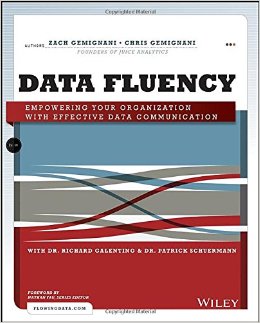
 You can’t get any more succinct than Zach and Chris Gemignani in their book “Data Fluency” — “You can’t dump data into an organization and expect it to be useful. Creating value from data is a complex puzzle; one that few organizations have solved.” The answer to why not is found partly in another of their excerpts “The goal of a data fluent culture, in part, is to ensure that everyone knows what is meant by a term like customer satisfaction. A data fluency culture breaks down when people spend more time debating terminology, calculations, and validity of data sources rather than discussing what action to take based on the results.”
Enter Governed Self Service
Enter Qlik Sense
Enter Architeqt
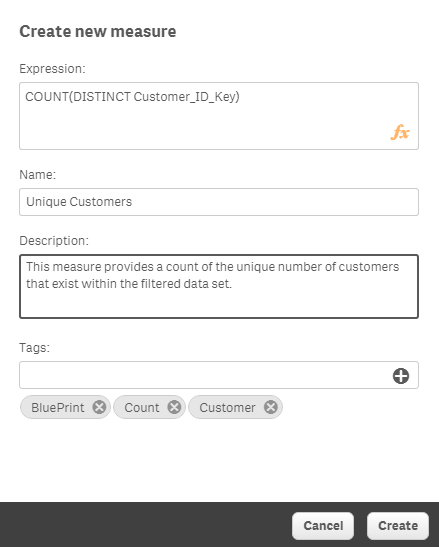
As I’ve literally crisscrossed the country this year presenting to potential (and existing) Qlik customers they love this concept. But many in IT have begged for even more governance. “Dalton that’s great but Dimensions and Measures are only defined within single applications. What happens if we make changes? How can we apply changes across all of the applications? What if we need to add more as we develop more sources of data? After 30 years in the IT trenches I can do nothing but whole heartedly agree with them because maintenance is one of those things that IT considers but many analysts don’t.
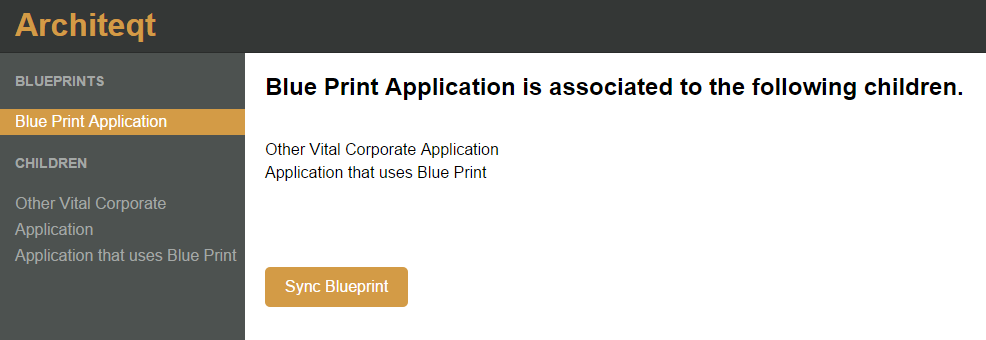
No problem because that’s where Architeqt comes in. Architeqt is the framework for providing serious data governance across all of your Qlik Sense applications and is the brain child of Alexander Karlsson. It provides you the ability to create what he calls “Blueprints” which are the dimensions/measures/visuals that you need to share across all of your applications and then … oh this is so cool … use those blueprints in any of your Qlik Sense applications. And keep them in synch when you make changes.
There are many very small incremental steps that I’ve seen in my career. But my hat goes off to him because Architeqt isn’t one of those things. To me what Alexander has created provides the infrastructure that IT has been clamoring for. It provides them the assurance that they can maintain all of those vital formulas across all of the applications while still allowing analysts to freely access data. Combined with the ease of use of Qlik Sense provides to analysts to grab data and go forth with consuming data it finally provides a framework for … say it with me … Governed Self Service.
Exit Stage Right
While I would love to go and on with lots of additional information I know this is the right time for me to step off the stage and allow you to dig into Architeqt for yourself. Simply click this link and it will take you directly to this phenomenal new extension. The site will contain all of the information you need to download and configure this Qlik Sense Extension as well as a nifty You Tube video where you can see it all in action.
Like the thought process? Check out all of my musings at QlikDork.com
- Mark as New
- Bookmark
- Subscribe
- Mute
- Subscribe to RSS Feed
- Permalink
- Report Inappropriate Content
We use the phrase "Curated Self Service" to do a similar thing. It avoids the negative connotations of "Managed" or "Governed" but it still reduces the "18 Versions of the truth" problem we all know so well!
I'll give the Architeqt link a whirl, it looks very interesting.
- Mark as New
- Bookmark
- Subscribe
- Mute
- Subscribe to RSS Feed
- Permalink
- Report Inappropriate Content
I like the word curated. As a museum "stands the test of time" kind of connotation.
Thanks for sharing.

