Unlock a world of possibilities! Login now and discover the exclusive benefits awaiting you.
- Qlik Community
- :
- Forums
- :
- Analytics & AI
- :
- Products & Topics
- :
- Integration, Extension & APIs
- :
- QlikSense Grid Chart extension unusual behavior
- Subscribe to RSS Feed
- Mark Topic as New
- Mark Topic as Read
- Float this Topic for Current User
- Bookmark
- Subscribe
- Mute
- Printer Friendly Page
- Mark as New
- Bookmark
- Subscribe
- Mute
- Subscribe to RSS Feed
- Permalink
- Report Inappropriate Content
QlikSense Grid Chart extension unusual behavior
Hi,
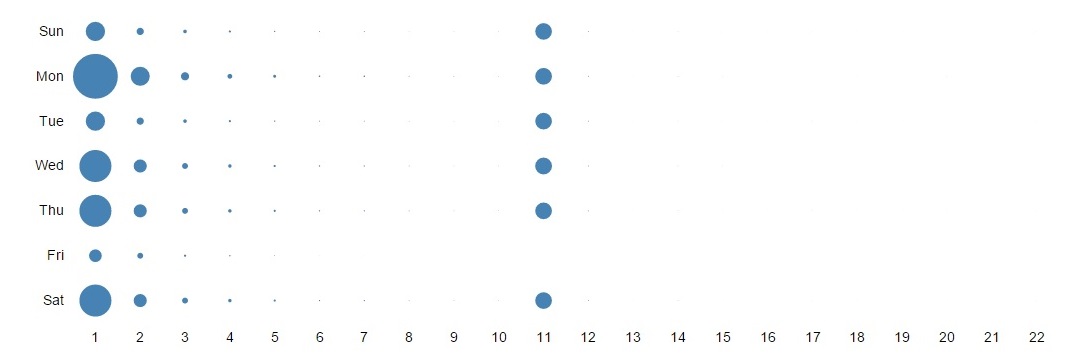
I am using a QlikSense Grid Chart extension to visualize some data as it is not available out of the box. I've downloaded the extension from Qlik Branch .The extension work in very random way in QlikSense desktop and Server.
In QlikSense desktop it works perfectly fine for me. However the chart created with same extension appears with vertical and horizontal scroll bars on Server. I am attaching the screenshot of chart developed in Desktop and Server. Can someone please provide me a solution on this. Or let me know if there is any other extension available for Grid Chart.
- Mark as New
- Bookmark
- Subscribe
- Mute
- Subscribe to RSS Feed
- Permalink
- Report Inappropriate Content
Hi Saurabh,
did you ever figure out what the issue was? I have come across a similar problem with charts and making selections