Unlock a world of possibilities! Login now and discover the exclusive benefits awaiting you.
Feb 8, 2023 6:18:37 AM
Mar 13, 2017 2:18:41 PM
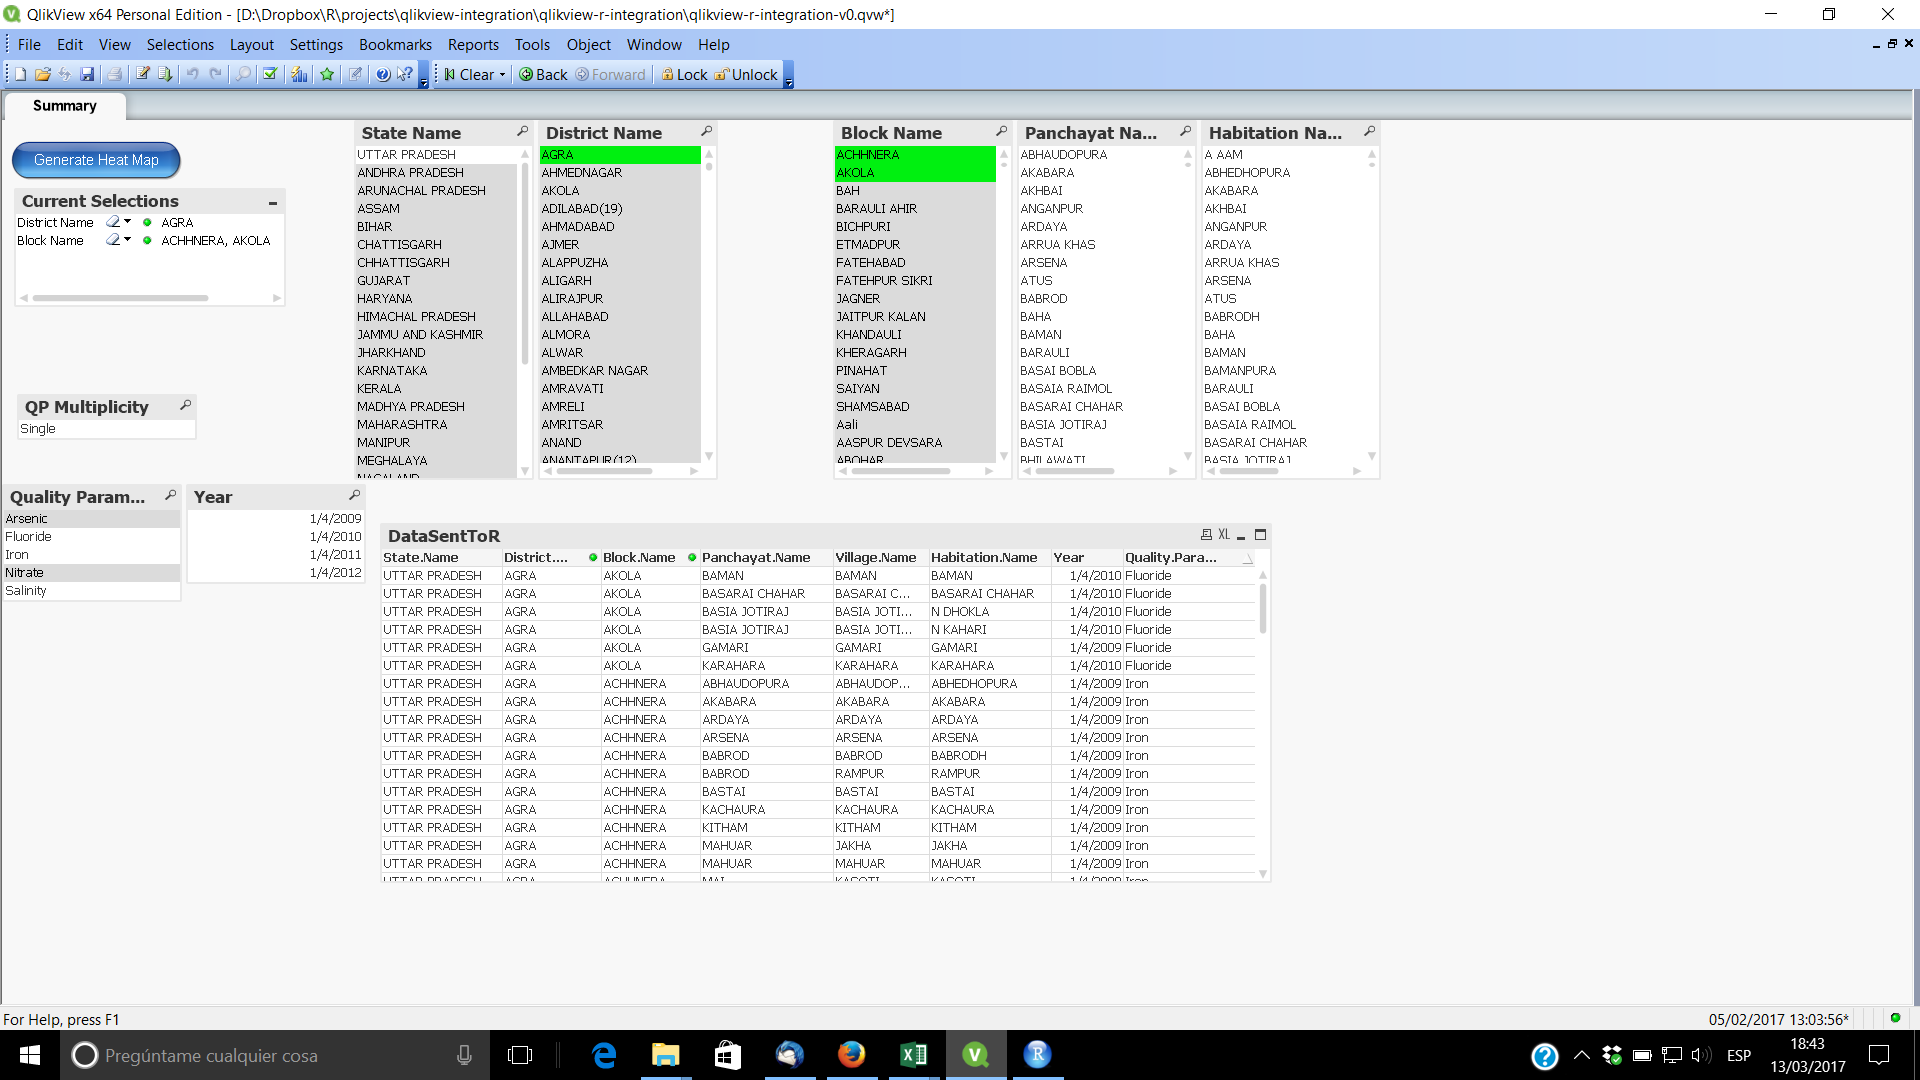
I recently finished a test of data integration of Qlikview and R. I used data from Indian Water Quality project at Kaggle to develop a prototype for plotting a heatmap upon setting a filter in Qlikview dashboard. Thanks to Brian Bauer (bbu) for his post QlikView and R Integration for Predictive Analytics Example the which I used as reference for this development.
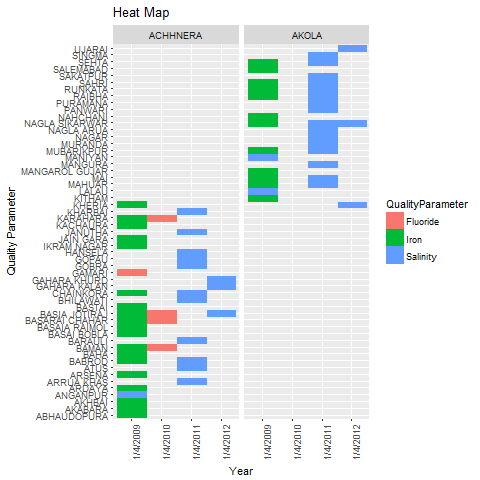
Upon clicking on the button "Generate Heat Map" a VB script is executed to initiate a session in R and plot a heatmap using ggplot library.
The procedure followed to generate such a graph was
Below you can see the VB script used for this purpose. Enjoy!
Sub plotHeatmap
' Export the selected patient data to be scored.
Set myTable = ActiveDocument.GetSheetObject("DataSentToR")
myTable.Export (CurrentPath & "/data/ExportFile.csv"), ";"
' Create a COM object representing R
Set R = CreateObject("StatConnectorSrv.StatConnector")
R.Init "R"
R.EvaluateNoReturn "library(rattle)"
R.EvaluateNoReturn "library(devtools)"
R.EvaluateNoReturn "library(ggplot2)"
R.EvaluateNoReturn "setwd(" & "'indian-water-quality'" & ")"
CurrentPathWindows = Replace(CurrentPath, "/", "\\")
R.EvaluateNoReturn "crs$water.quality1<-read.csv(file=" & "'" & CurrentPathWindows & "\\data\\ExportFile.csv" & "'" & ",sep=';'" & ")"
R.EvaluateNoReturn "saveRDS(crs$water.quality1, file = 'water.quality1.rds')"
R.EvaluateNoReturn "names(crs$water.quality1)<-c( 'StateName','DistrictName','BlockName','PanchayatName','VillageName','HabitationName','Year','QualityParameter')"
' source("water-quality-data-preparation-v3.R")
R.EvaluateNoReturn "source('https://github.com/rventuradiaz/indian-water-quality/raw/master/water-quality-data-preparation-v4.R')"
R.EvaluateNoReturn "wq_df <-wq1_df(crs$water.quality1)"
R.EvaluateNoReturn "png('Rplot_Panchayat_ggplot.png')"
R.EvaluateNoReturn "plothm <- draw_hm(data=wq_df, x=wq_df$Year, y=wq_df$PanchayatName, fillInput = wq_df$QualityParameter, facetInput = . ~ BlockName, fill_discrete='QualityParameter')"
R.EvaluateNoReturn "print(plothm)"
R.EvaluateNoReturn "dev.off()"
' Close R connection
R.close
End Sub
Hi Rafael,
thank you for your efforts in providing this discussion.
I'm trying to get oriented in QlikView and in particular, how to integrate it with R.
One query on your discussion above in relation to the first step in the process you've outlined:
1.1. Export data from Qlikview to a CSV text file.
where did this data originally come from? i.e. how did it get imported into QlikView in the first place?
cheers
Matt
Hi Matt,
Data originally came from Kaggle. You can see a reference in my blog (Indian Water Quality Visualization Using Heatmaps | Data Science for Water Project's Business Analys...) or going to original source in Kaggle (https://www.kaggle.com/venkatramakrishnan/india-water-quality-data)
Data was downloaded in CSV textfile format. I uploaded into Qlikview and developed the Qlikview dashboard from it.
Best regards,
Rafael