Unlock a world of possibilities! Login now and discover the exclusive benefits awaiting you.
- Qlik Community
- :
- Support
- :
- Support
- :
- Knowledge
- :
- Member Articles
- :
- How to Add Totals and Subtotals to PixelPerfect Re...
- Edit Document
- Move Document
- Delete Document
- Subscribe to RSS Feed
- Mark as New
- Mark as Read
- Bookmark
- Subscribe
- Printer Friendly Page
- Report Inappropriate Content
How to Add Totals and Subtotals to PixelPerfect Reports
- Move Document
- Delete Document
- Mark as New
- Bookmark
- Subscribe
- Mute
- Subscribe to RSS Feed
- Permalink
- Report Inappropriate Content
How to Add Totals and Subtotals to PixelPerfect Reports
Begin Creating New PixelPerfect Report
Open the NPrinting Project NPrintingTraining.nsq found in the C:\NPrintingTraining\NPrintingFiles\ folder.
- Select Reports in the lower left pane
- Select PixelPerfect reports
- Click on the PixelPerfect Report icon to create a new report
Name Report and Open New Template in Template Editor
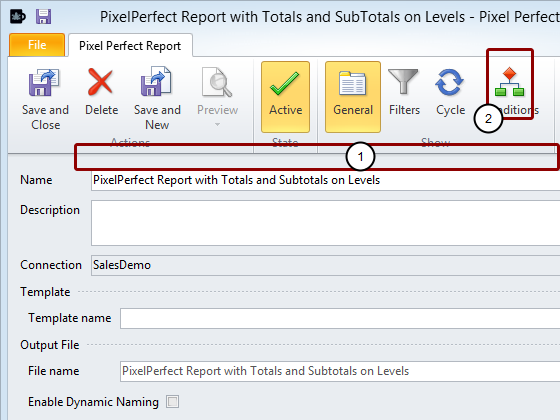
- Enter PixelPerfect Report with Totals and SubTotals on Levels as the report Name
- Click on New in the Template group of the tool bar to create a new template
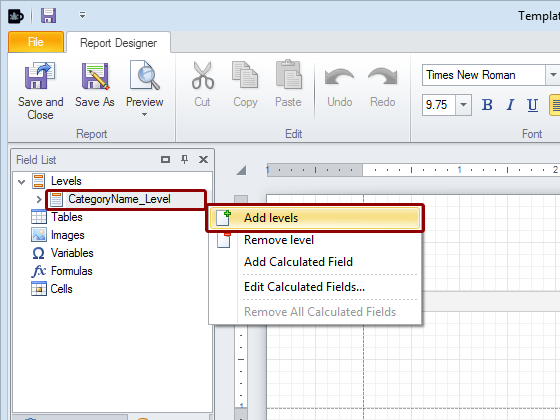
Add Levels to Template

- Right click on the Levels node
- Click on Add levels in the pop-up menu
Select Object for Level
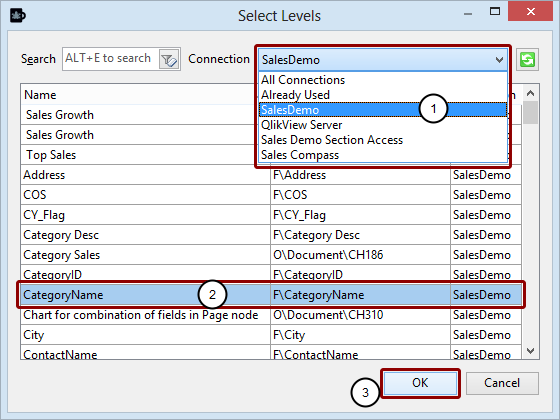
- Select the Connection to the QlikView document that contains the object you want
- Select the CategoryName field
- Click on the OK button
Begin Nesting Levels
- Right click on the CategoryName_Level node
- Click on Add levels in the pop-up menu
Select Object for Sub-level

- Select the Connection to the QlikView document that contains the object you want
- Select the Top 25 Products chart
- Click on the OK button
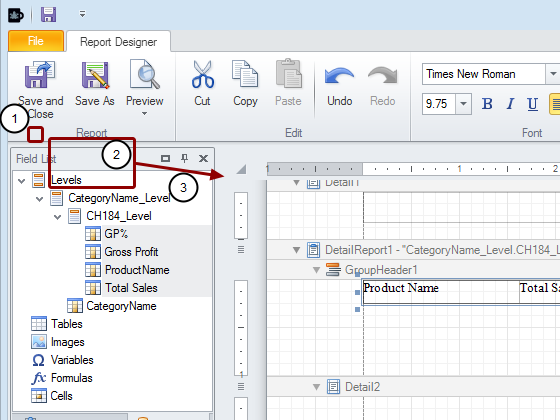
Begin Creating Levels in Template
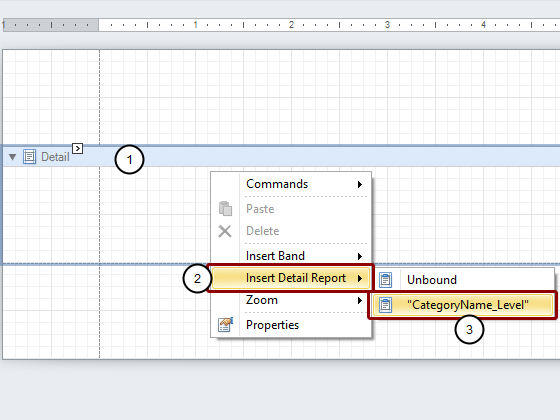
- Right click on the Detail bar or within its range
- Select Insert Detail Report
- Select “CategoryName_Level”
Embed Field in Detail1 Band
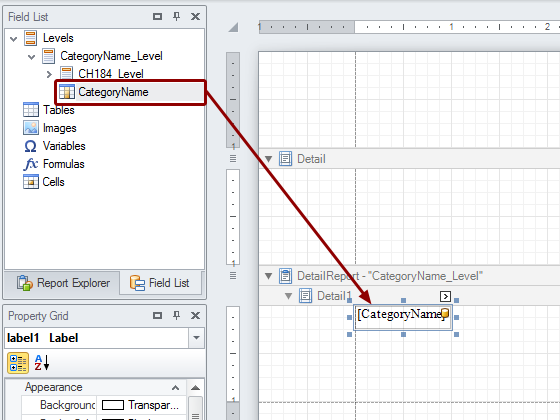
Drag the CategoryName node token from the Levels hierarchy and drop it into the Detail1 open template area.
Format Category Heading
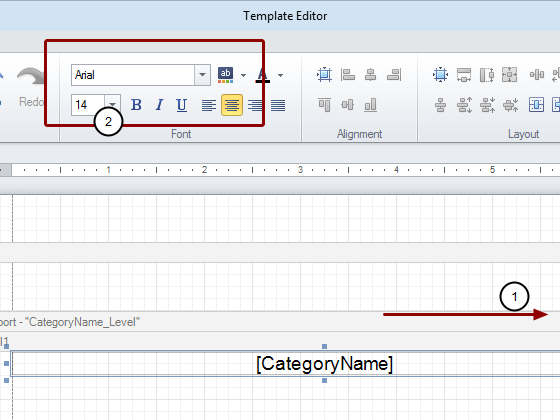
- Drag the label left and right borders to cover the entire width of the range from margin to margin
- Set the font to Arial, 16pt, Bold, centered or format it as is appropriate for a category heading
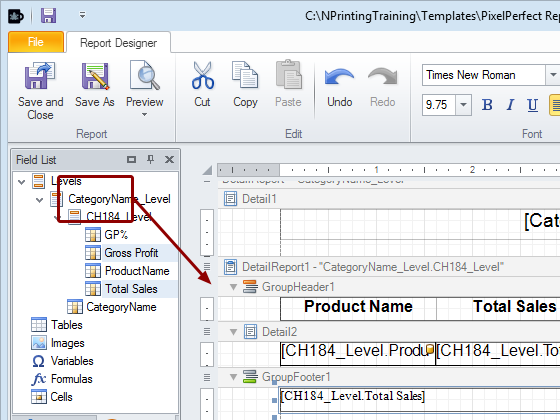
Create the CH184 Sublevel

- Right click on the DetailReport - “CategoryName_Level” bar
- Select Insert Detail Report
- Select “CH184_Level”. The result is DetailReport1 - “CategoryName_Level.CH184_Level” bar.
Add Group Header
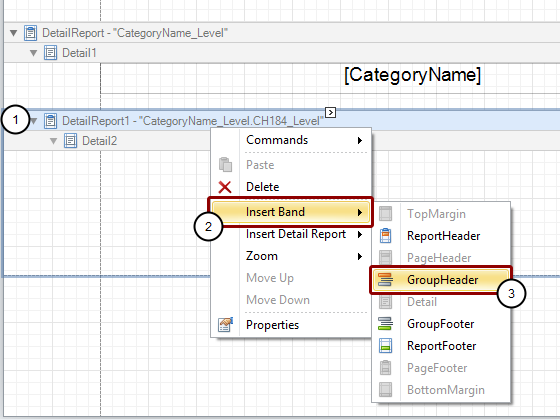
- Right click on the DetailReport - “CategoryName_Level.CH184_Level” bar
- Select Insert Band
- Select “GroupHeader”. The result is a “GroupHeader1” bar appears.
Add Group Footer
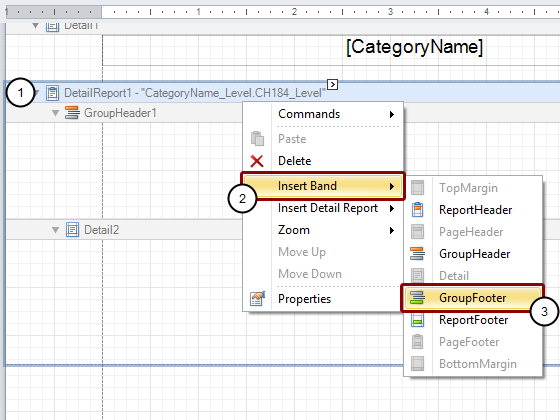
- Right click on the DetailReport - “CategoryName_Level.CH184_Level” bar
- Select Insert Band
- Select “GroupFooter”. The result is a “GroupFooter1” bar appears.
Embed Headings in Template
- Expand the CH184_Level by clicking on the right pointing chevron to its left
- Hold down the CTRL or the SHIFT key on your keyboard and keep it so while you select the following fields in the order specified:
- ProductName
- Total Sales
- Gross Profit
- GP%
- Right click the mouse on these selected fields then drag and drop them into the GroupHeader1 range so that the upper border of the fields are aligned with the lower border of the GroupHeader1 bar. NPrinting automatically creates a table with the column names in the selected order!
Format Heading Text
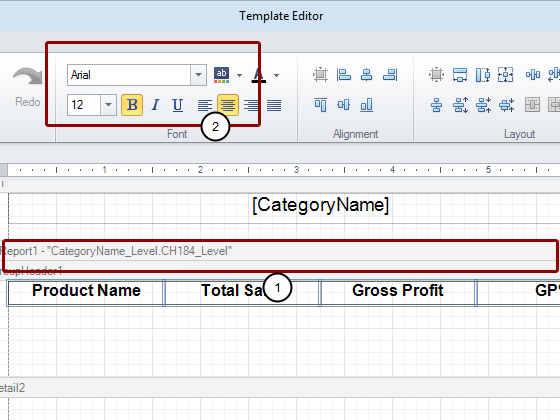
- Select the entire header table
- Format the text Arial, 16px, Bold, centered or as appropriate
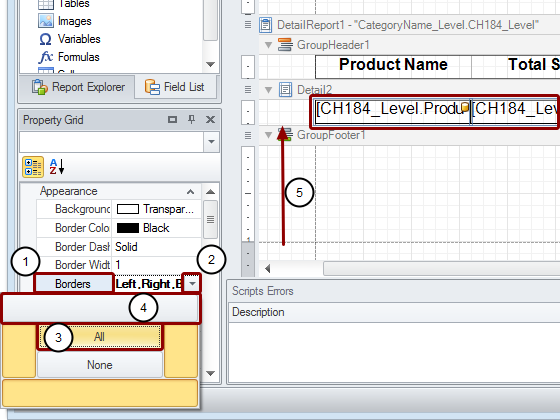
Format Heading Borders

- Select the Borders option in Property Grid, which is the lower left pane
- Open the drop-down menu by clicking on the down-pointing triangle at the extreme right of the field
- Click on All to render all cell borders visible
- Drag the Detail2 bar upper border till it coincides with the lower border of the GroupHeader1 border to eliminate the white space between the headings and the data in the final report
Embed Data in Template

- Hold down the CTRLkey on your keyboard and keep it so while you select the following fields in the order specified:
- ProductName
- Total Sales
- Gross Profit
- GP%
- Left click and drag the collection of highlighted data fields and drop them into the Detail2 range so that the upper border of the fields are aligned with the lower border of the Detail2 bar. NPrinting automatically creates a table with the tags for the columns of data in the order that they are selected.
Format Data in Template

- Select the whole row of data field tags
- Format them Arial & 12pt
Render Borders Visible and Eliminate White Space
- Select the Borders option in Property Grid, which is the lower left pane
- Open the drop-down menu by clicking on the down-pointing triangle at the extreme right of the field
- Click on All to render all cell borders visible
- Deselect the top border
- Drag the GroupFooter1 bar upper border till it coincides with the lower border of the Detail2 range border to eliminate the white space between the footer and the data in the final report
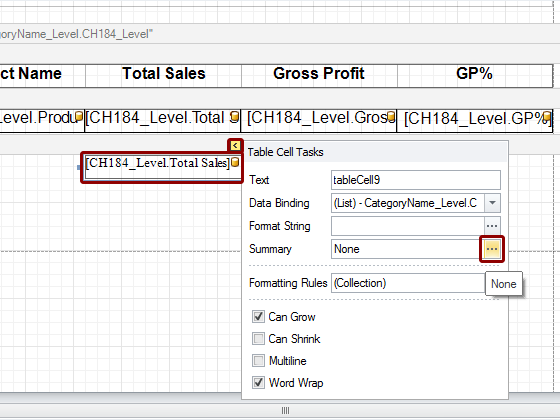
Open Table Cell Tasks and FormatString Editor
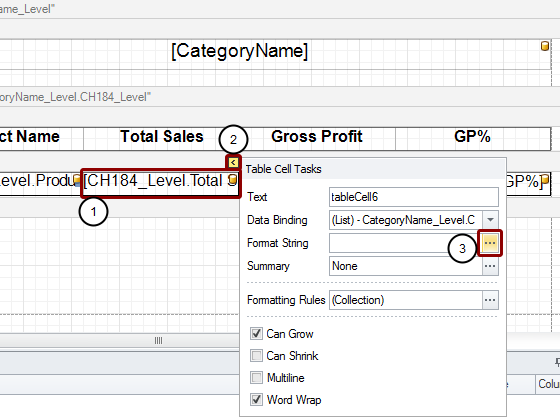
- Select the CH184_Level.Total Sales cell
- Click on the small arrow above the upper right corner of the cell
- Click on the browse button at the extreme right of the Format String field
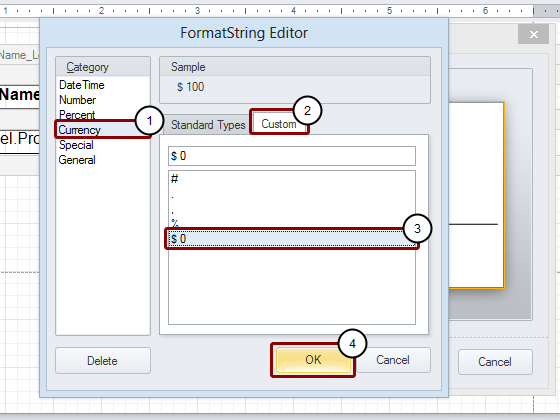
Format "CH184_Level.Total Sales" Cell
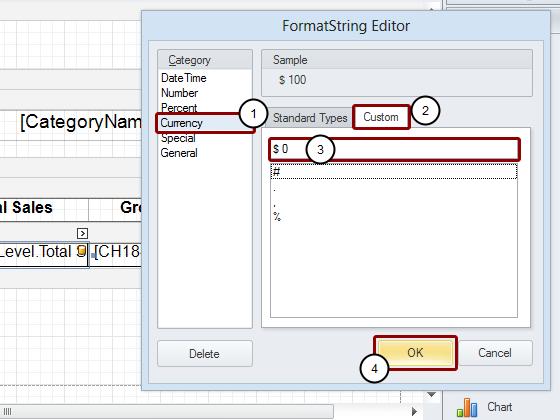
- Select Currency
- Select Custom
- Enter $ 0
- Click on the OK button
- Right justify the text
Format "CH184_Level.Gross Profit" Cell
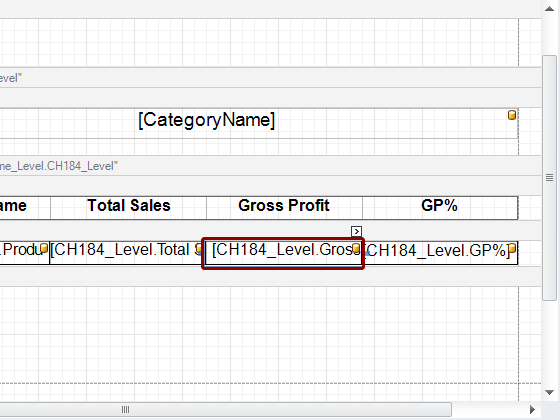
Repeat the above process for the CH184_Level.Gross Profit cell.
Format "CH184_Level.GP%" Cell

- Select the CH184_Level.GP% cell
- Open the FormatString Editor again
- Select Percent
- Click on 0.00%
- Click on the OK button
- Right justify the text
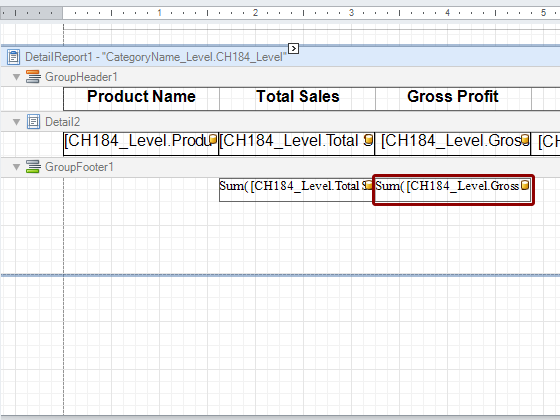
Start Creating Subtotals
- Hold down the CTRL key on your keyboard and keep it so while you select the following fields in the order specified:
- Total Sales
- Gross Profit
- Drag the collection of highlighted data field node tokens and drop them into the GroupFooter1 range so that the upper border of the fields are aligned with the lower border of the GroupFooter1 bar.
Adapt Cells
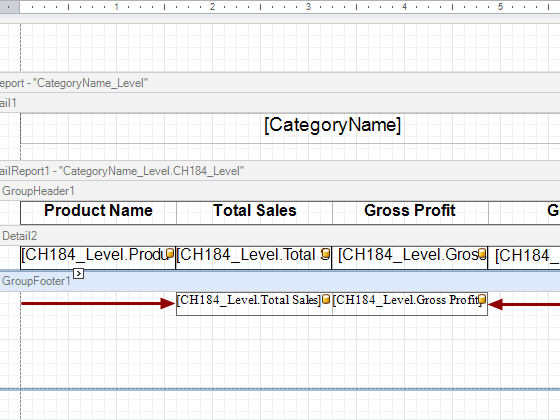
Drag the left border of the CH184_Level.Total Sales cell and the right border of the CH184_Level.Gross Profit cell inGroupFooter1 until they line up with those of the corresponding cells in Detail2.
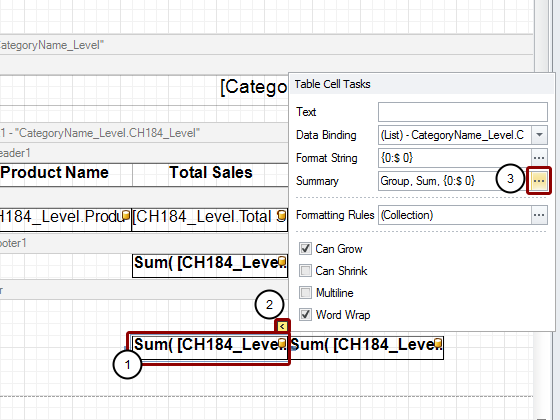
Open Summary Editor for CH184_Level.Total Sales Cell
- Select the CH184_Level.Total Sales cell
- Click on the small arrow above the upper right corner of the cell
- Click on the browse button at the extreme right of the Summary field
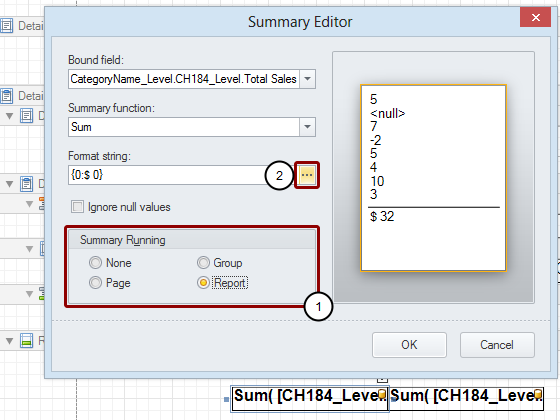
Set Summary Running and Open Format String Editor

- Set the Summary Running radio button to Group
- Click on the browse button at the extreme right of the Format string field
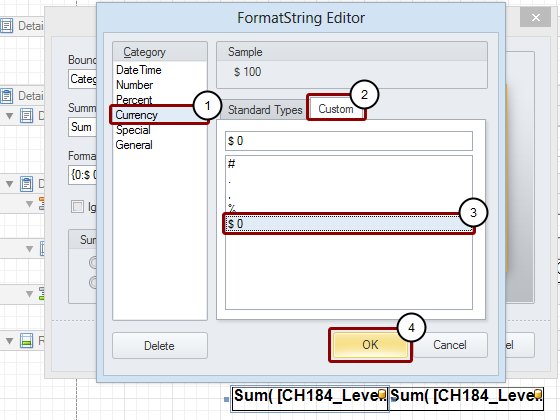
Format Cell Content and Close
- Select Currency
- Select the Custom tab
- Choose the $ 0 format
- Click on the OK button
Close Summary Editor
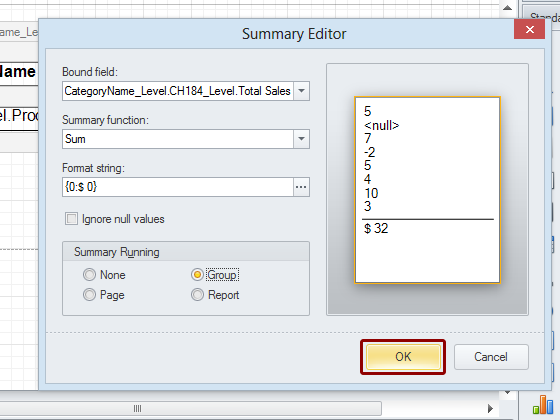
Click on the OK button.Note that the cell content has become Sum([CH184_Level.Total Sales]).
Repeat Process for CH184_Level.Gross Profit Cell
Repeat the above process for the CH184_Level.Gross Profit cell.
Format Subtotal Cell Content
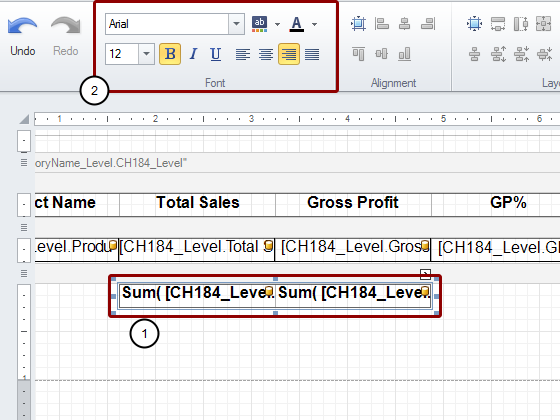
- Select the two subtotal cells by drawing a rectangle that includes both while holding the left mouse button down
- Format the text as Arial, 12px, Bold, Right justified
Render Subtotal Cell Borders Visible and Eliminate White Space
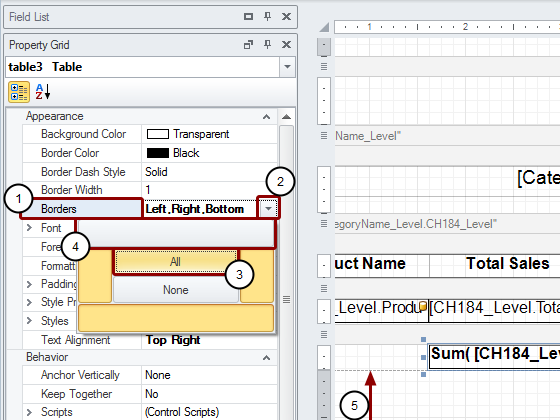
- Select the Borders option in Property Grid, which is the lower left pane
- Open the drop-down menu by clicking on the down-pointing triangle at the extreme right of the field
- Click on All to render all cell borders visible
- Deselect the top border
- Drag the GroupFooter1 range lower border till it coincides with the lower border of the subtotal cell lower border to eliminate the white space below the footer in the final report
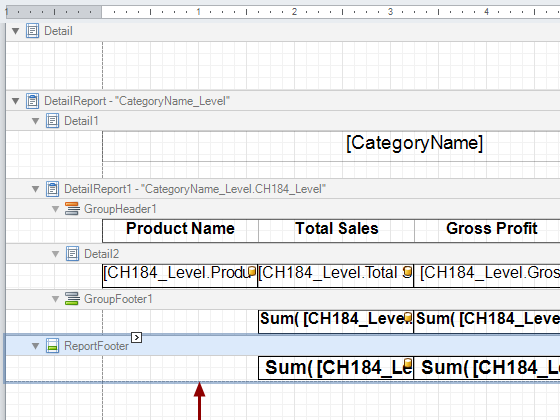
Begin Creating Report Totals
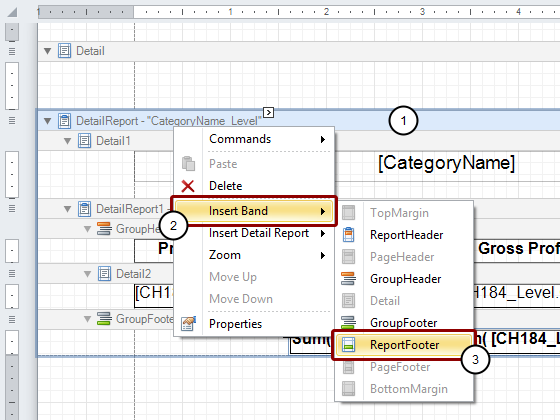
- Right click on the DetailReport - “CategoryName_Level” bar
- Select Insert Band
- Select “ReportFooter”. The result is a “ReportFooter1” bar appears.
Copy Subtotal Cells
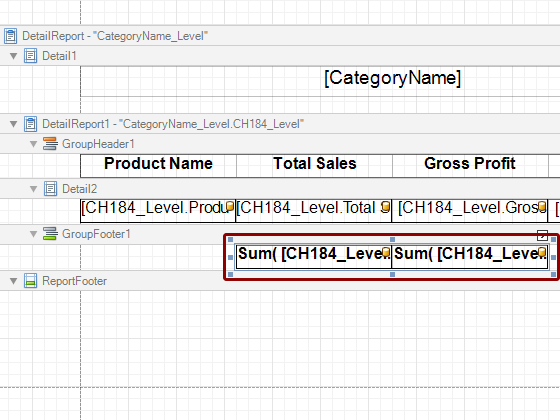
Select both sum cells in GroupFooter1 and copy them by pressing Ctrl + C.
Paste Subtotal Cells in ReportFooter
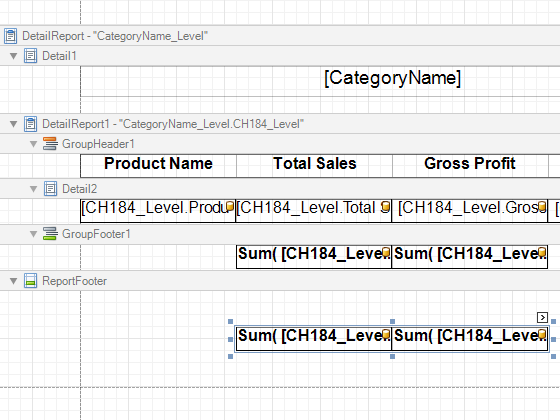
Paste them into ReportFooter by selecting the ReportFooter range and pressing Ctrl + V.
Open Summary Editor
- Select the Sum([CH184_Level.Total Sales]) cell in ReportFooter
- Click on the small arrow above the upper right corner of the cell
- Click on the browse button at the extreme right of the Summary field
Set Summary Running and Open FormatString Editor
- Set the Summary Running radio button to Report
- Click on the browse button at the extreme right of the Format string field
Format Cell Data Content
- Select Currency
- Select the Custom tab
- Choose the $ 0 format
- Click on the OK button
Close Summary Editor
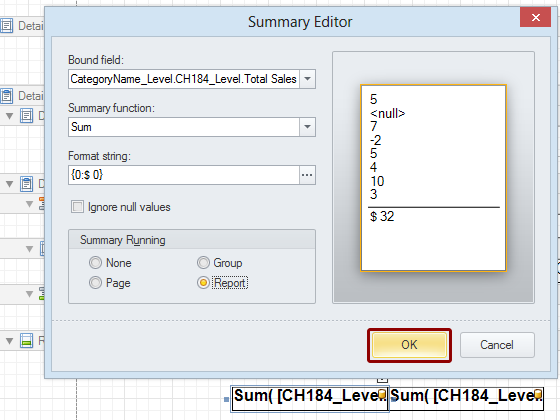
Click on the OK button. Repeat the above process for the Sum([CH184_Level.Total Sales]) cell in ReportFooter.
Format Report Total Cell Contents
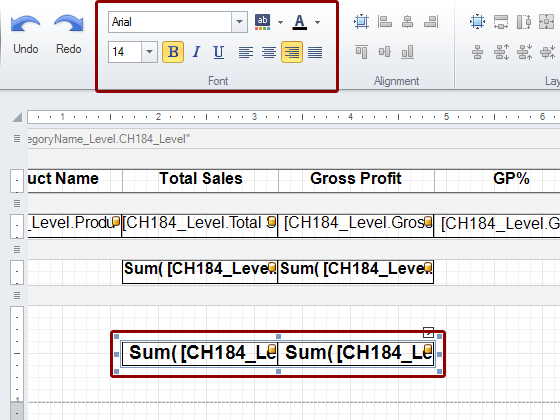
Format the text as Arial, 14px, Bold, Right justified.
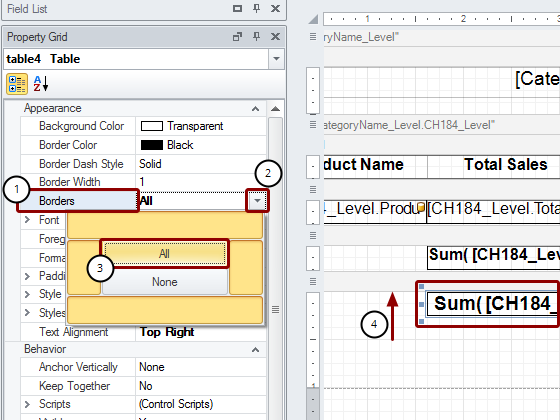
- Select the Borders option in Property Grid, which is the lower left pane
- Open the drop-down menu by clicking on the down-pointing triangle at the extreme right of the field
- Click on All to render all cell borders visible
- Drag the Report Total cell upper border till it coincides with the lower border of the ReportFooter bar lower border to eliminate the white space between the Category Subtotals and the Report Totals in the final report
Drag the ReportFooter range lower border up to coincide with the Report Total cell lower border to eliminate the white space at the bottom of the report.
Save Template
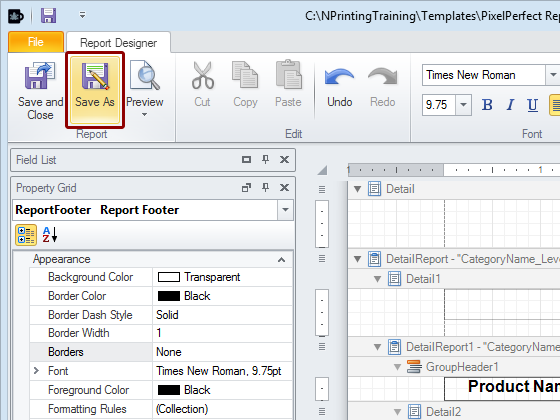
Click on the Save As icon in the Report group.
Name and Save to Specific Folder
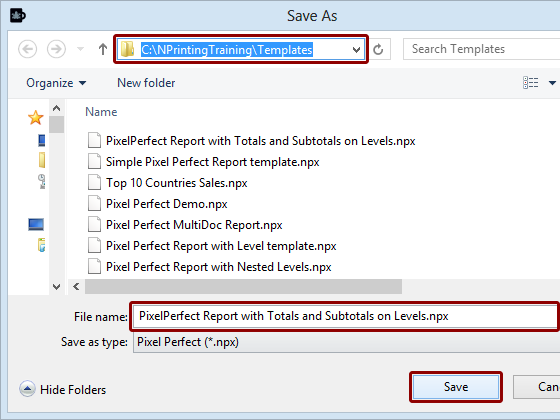
- Make sure the Save As window is opened in the C:\NPrintingTraining\Templates folder, browse to it if not
- Enter a File name or accept the suggested one
- Click on the Save button
Preview Report
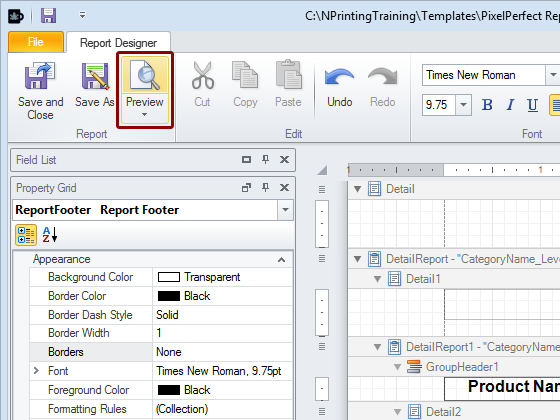
Click on the upper part of the Preview icon in the Report group.
Inspect Report Detail
