Unlock a world of possibilities! Login now and discover the exclusive benefits awaiting you.
- Qlik Community
- :
- Support
- :
- Support
- :
- Knowledge
- :
- Member Articles
- :
- How to Create One or More Levels in Excel Reports
- Move Document
- Delete Document
- Subscribe to RSS Feed
- Mark as New
- Mark as Read
- Bookmark
- Subscribe
- Printer Friendly Page
- Report Inappropriate Content
How to Create One or More Levels in Excel Reports
- Move Document
- Delete Document
- Mark as New
- Bookmark
- Subscribe
- Mute
- Subscribe to RSS Feed
- Permalink
- Report Inappropriate Content
How to Create One or More Levels in Excel Reports
Description: This tutorial is intended to illustrate the creation of NPrinting of Excel reports containing one or more levels. It is presumed that you are familiar with common NPrinting procedures.
We are going to embed a QlikView object as a table and one as an image in an Excel report. We are then going to select two fields as levels so that the Excel report presents three tiers of information with titles and headings.
Open an existing NPrinting document or a new one. We will use a sample QlikView document, SalesDemo.qvw, which is found in the NPrinting Training Environment available on the NPrinting Training Material page. Once NP_Training.zip has been downloaded, extract it into C:\NPrintingTraining\ so that the relative path structure remains valid. Establish a connection to it (see: How do I connect to my QlikView documents?).
Create New Excel Report
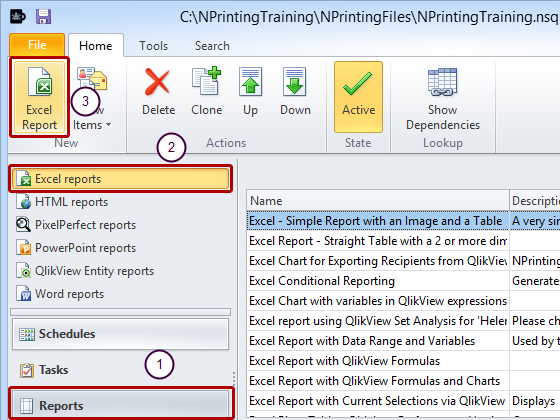
- Select Reports in the lower left-hand pane
- Select the Excel reports type in the pane immediately above
- Select Excel Report in the New group of the tool bar
Begin Creating New Report
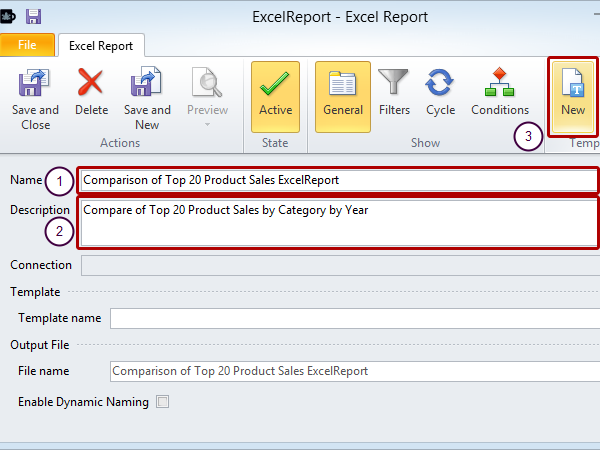
- Enter a Name for your report
- Enter a Description (optional)
- Select New in the Template group of the tool bar to open the Template Editor
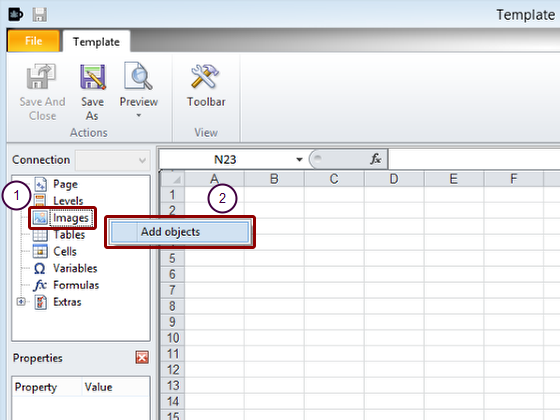
Open Select Objects Window

- Right click on the Images node icon or label in the left pane
- Click on the Add object icon
Import QlikView Object as Image

- Select the Connection to the QlikView document that contains the object you want
- Select the QlikView object CH192 in the Select object window to be included in your template as an image
- Click on the OK button
Add QlikView Object as Table
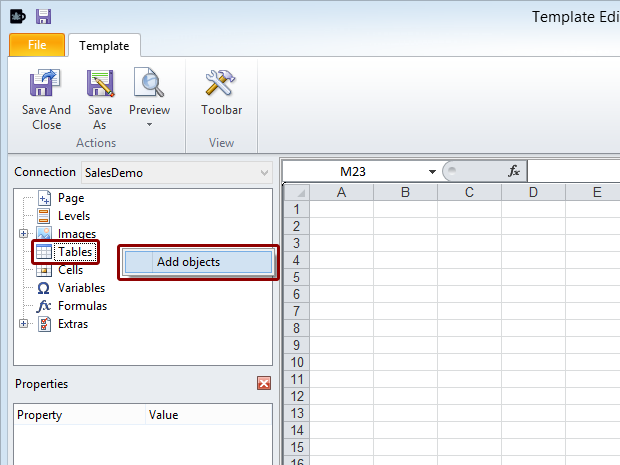
- Right click on the Tables node icon or label in the left pane
- Select Add object
Select Object as Table
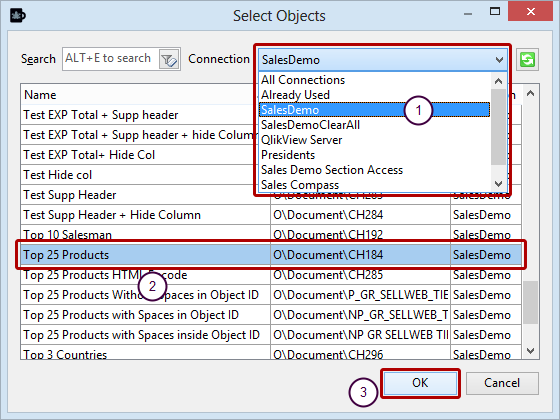
- Select the Connection to the QlikView document that contains the object you want
- Select the QlikView object CH184 in the Select object window to be included in your template as a table
- Click the OK button
Open the Select Levels Window
- Right click on the Levels node icon or label in the left pane
- Select Add level
Add Level to Template
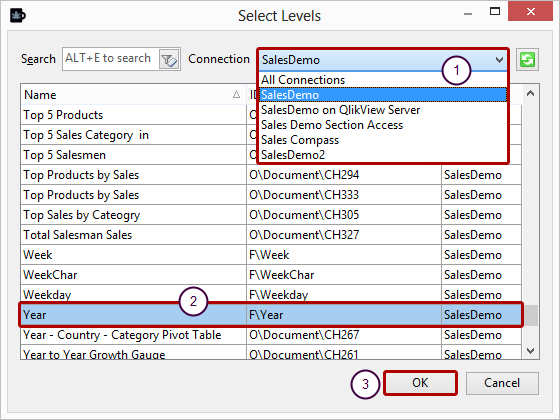
- Select the Connection to the QlikView document that contains the object you want
- Select the QlikView Year field in the Select levels window
- Click on the OK button
Open the Select Levels Window
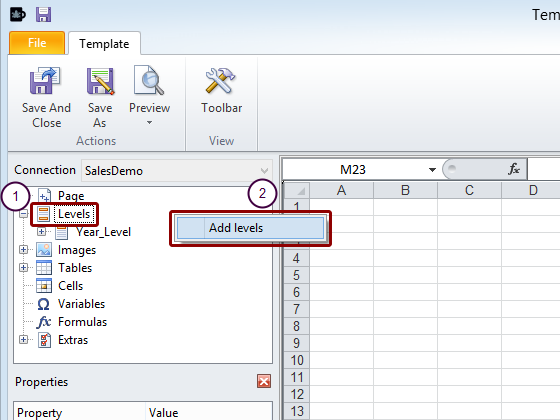
- Right click on the Levels node icon or label in the left pane
- Click on the Add levels icon
Add Second Level to Template
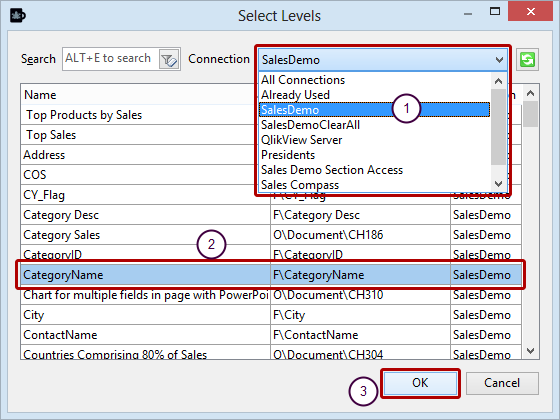
- Select the QlikView CategoryName field in the Select level window
- Click on the OK button
Embed Image and Table in Template
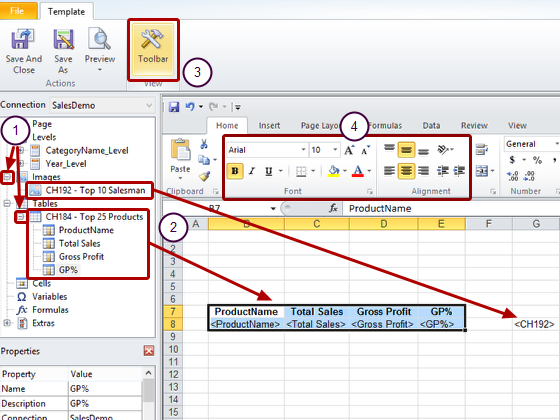
- Expand the Images and Tables nodes in the left pane by clicking on the '+'s to their left
- Drag and drop the CH184 and CH192 tokens into empty cells Make sure to place the CH192 tag on the same line as the tags forCH184
- Open the Excel tool bar by clicking on Toolbar, if it is not already open
- Apply appropriate formatting to the column headings
Apply First Level
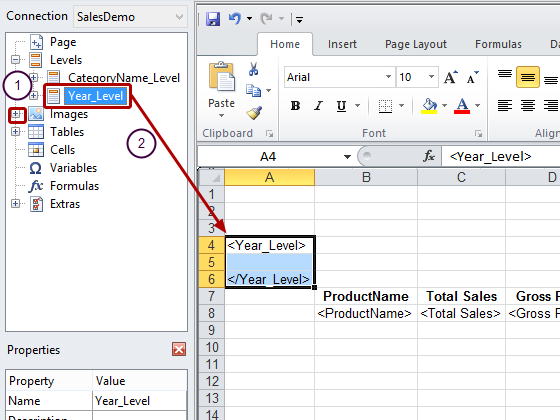
- Expand the Levels node in the left pane by clicking on the '+' to its left, if Year_Level and CatagoryName_Level nodes are not visible
- Drag and drop the Year_Level token into an empty cell at the top of a group of three vertically contiguous empty cells
Add Field Name as Header
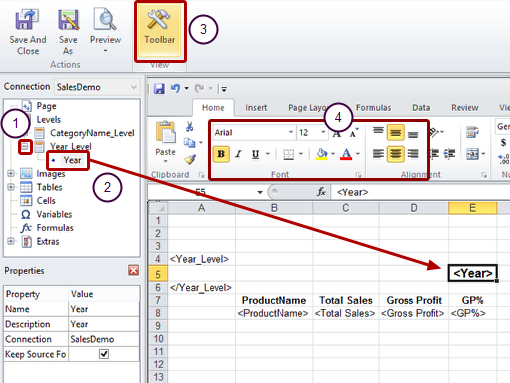
- Expand the Year_Level node in the left pane by clicking on the '+' to its left, if the Year node is not visible
- Drag and drop the Year node token into an empty cell
- Open the Excel tool bar by clicking on Toolbar, if it is not already open
- Apply appropriate formatting to the Year tag
Position Level Tags
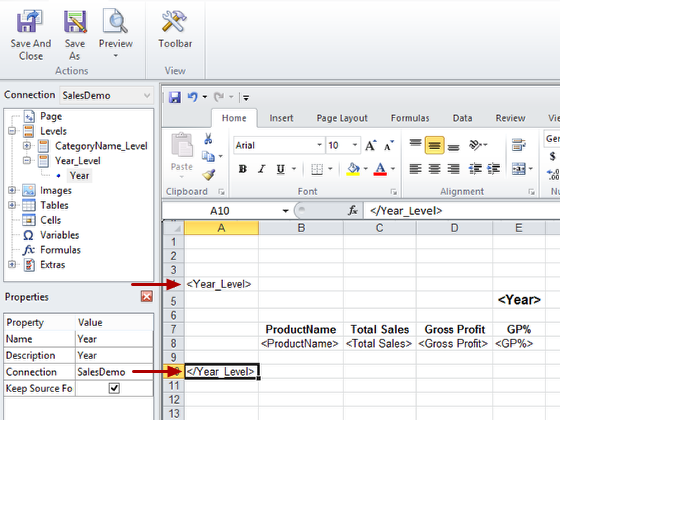
- The opening level tag is in a row above any and all rows to be repeated in the level cycle and in the same column or a column to the left of any and all columns to be repeated in the level cycle. Empty rows included in the level range will be reproduced in the level cycle.
- The closing level tag must be in a row below any and all rows to be included in the level cycle.
Verify Level Range
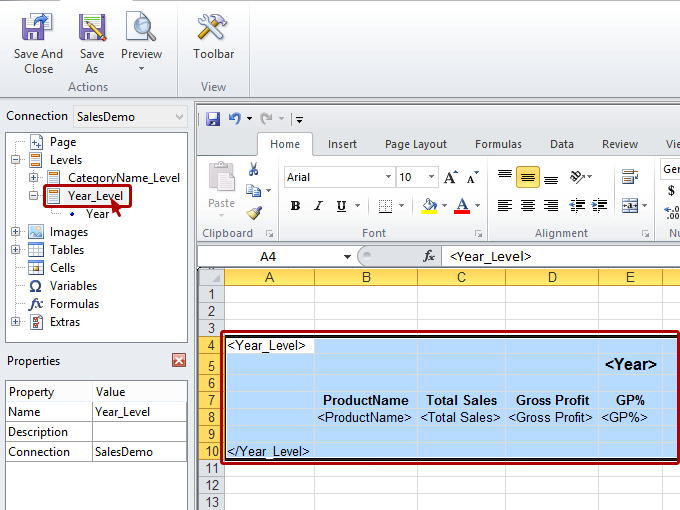
Verify the elements to be cycled in the level by clicking on the Year_Level node in the left pane. The level range becomes delimited and highlighted
Apply Second Level
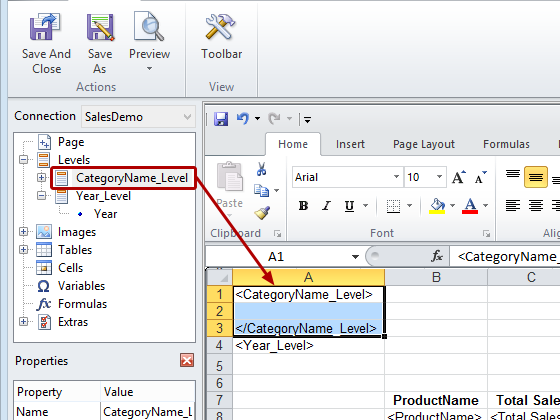
Drag and drop the CategoryName_Level token into an empty cell at the top of a group of three vertically contiguous empty cells. Its current three cell range is delimited and highlighted.
Add Field Name as Header
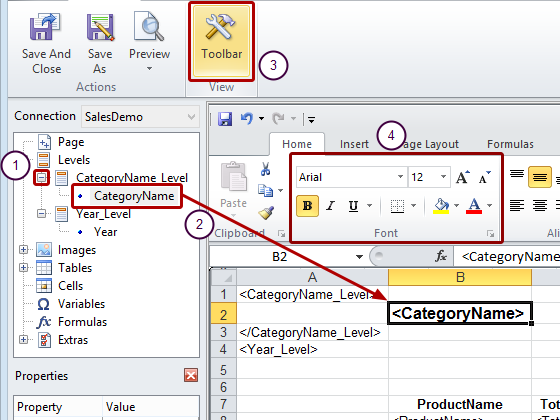
- Expand the CategoryName_Level node in the left pane by clicking on the '+' to its left, if the CategoryName node is not visible
- Drag and drop the CategoryName node token into an empty cell
- Open the Excel tool bar by clicking on Toolbar, if it is not already open
- Apply appropriate formatting to the CategoryName tag
Determine Level Range by Positioning Level Tags
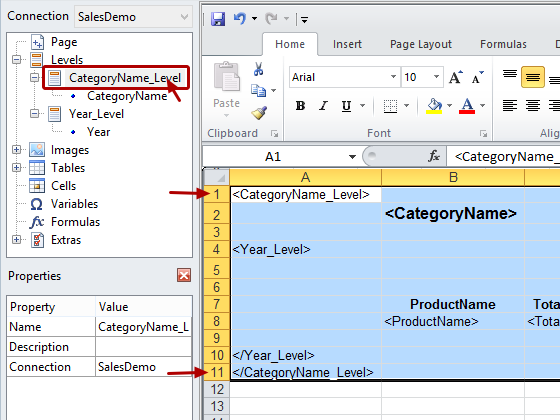
Position the level tags as described in the Position the Level Tags section above and verify the extent of the level range
Conclude Template Editing and Preview Resulting Excel Report
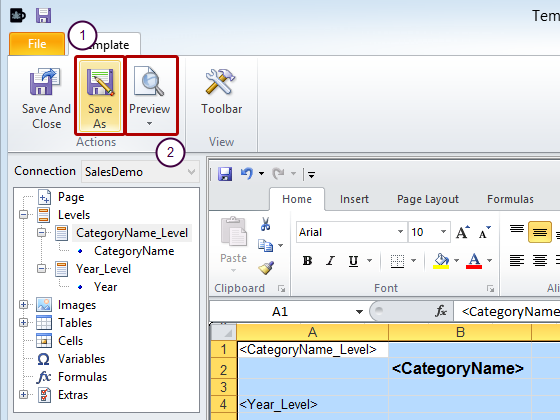
- Click on the Save As icon with the default or some other appropriate name for your template
- Click on the Preview icon in the Actions group in the Template Editor window
Result
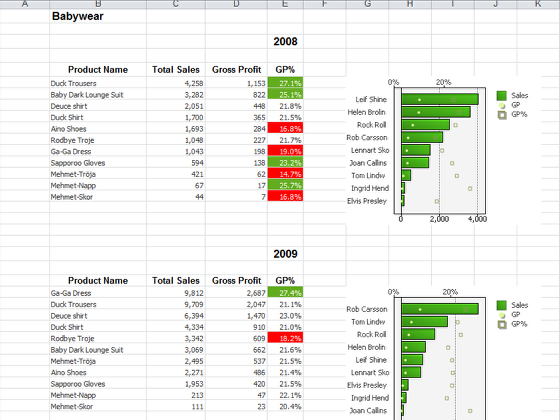
The resulting Excel report should look like this.