Unlock a world of possibilities! Login now and discover the exclusive benefits awaiting you.
- Qlik Community
- :
- Support
- :
- Support
- :
- Knowledge
- :
- Member Articles
- :
- Period Presets: Compare Periods on the fly
- Edit Document
- Move Document
- Delete Document
- Subscribe to RSS Feed
- Mark as New
- Mark as Read
- Bookmark
- Subscribe
- Printer Friendly Page
- Report Inappropriate Content
Period Presets: Compare Periods on the fly
- Move Document
- Delete Document and Replies
- Mark as New
- Bookmark
- Subscribe
- Mute
- Subscribe to RSS Feed
- Permalink
- Report Inappropriate Content
Period Presets: Compare Periods on the fly
Oct 18, 2022 6:44:11 AM
Jul 7, 2016 8:56:29 AM
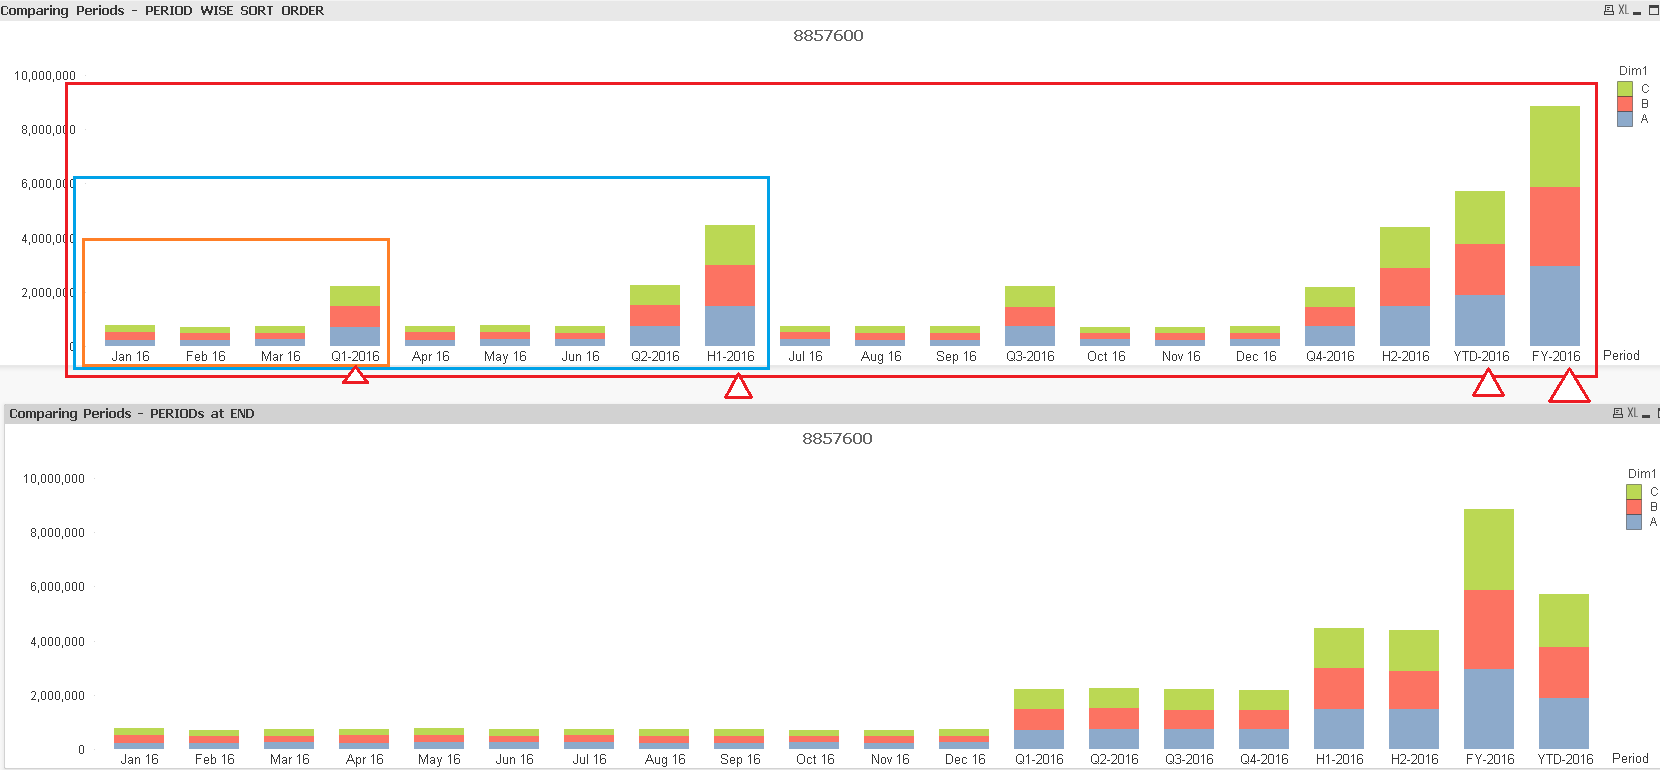
Preset Calendar now with Sort Order
Added two Sorting Order options.
First chart showing Periods immediately after the period ends
example; Q1 after Jan,Feb,Mar and H1 immediately after 1st half of the year is completed.
While the Second chart shows Period totals towards the end.

||||||||||||||||||||||||||||||||||||||||||||||||||||||||||||||||||||||||||||||||||||||||||||||||||||||||||||||||||||||||||||||||||||||||||||||||||||||||||||||||||||||||||||||||||||||||||||||||||||||||||||||||||||||||||||||||||||||||||||||||||||||||||||||
Comparing metrics for two or more periods is probably a common scenario for all developers in all organizations no matter what domain they are working in.
A Trend comparison between two or more periods for which we’ve been performing set analysis using variables. My App is a simple transformation of the Master Calendar, which allows the users to visualize and evaluate data across multiple periods dynamically without using variables.
For people who think master calendar is of no use, this is probably the best way you would actually making use of it.
Benefits:
- Most beneficial for ease of visualization and provides easy filters for comparing periods for Business users
- No greater than less Set Analysis for comparing dates between
- Simplifies expressions for faster dashboard performanceJ
- Extended Flexibility for comparing multiple periods, without being restricted by variables.
Attached is just a sample made with Auto generated data.
I would like to hear expert’s reviews.
Cheers
V
Vineeth Pujari
- Move Comment
- Delete Comment
- Mark as Read
- Mark as New
- Bookmark
- Permalink
- Report Inappropriate Content
Hi Vineeth,
Nice work,pls share the script in a word document so it will be useful for PE users.
- Move Comment
- Delete Comment
- Mark as Read
- Mark as New
- Bookmark
- Permalink
- Report Inappropriate Content
Very nice
Thank's for sharing.
Saludos,
Enrique Colomer
- Move Comment
- Delete Comment
- Mark as Read
- Mark as New
- Bookmark
- Permalink
- Report Inappropriate Content
Great contribution, will give it a try.
Thanks a lot!
- Move Comment
- Delete Comment
- Mark as Read
- Mark as New
- Bookmark
- Permalink
- Report Inappropriate Content
Hi Joshua,
Added script in word document, should be visible after moderation is completed.
Cheers
V
- Move Comment
- Delete Comment
- Mark as Read
- Mark as New
- Bookmark
- Permalink
- Report Inappropriate Content
Excellent article, Vineeth, but I couldn't resist of removing the following categories that it shouldn't belong to. Just for keeping their contents as clean as possible.
Developer Toolkit
Management
- Move Comment
- Delete Comment
- Mark as Read
- Mark as New
- Bookmark
- Permalink
- Report Inappropriate Content
Hi Vineeth, thanks a lot for you contribution. I am using this excellent approach in a Qlik Sense app. Anyway I am not able to perform Year Over Year comparisons, disregarding the PeriodCat selected.
For example, I need the value from FY-2015 to appear under FY-2016, FY-2014 to appear under FY-2015, etc, so that I can afterwads calculate growth (FY-2016/FY-2015-1, etc) for every category. Can you please advise on how to do this?
I am attaching an image to make the example more clear. In last table I want 431.861.308 (FY-2015) to appear under FY-2016 so that I can then calculate = 537.679.781/431.861.3081-1
Thanks

- Move Comment
- Delete Comment
- Mark as Read
- Mark as New
- Bookmark
- Permalink
- Report Inappropriate Content
try below to show percentage for only the Max FY- Period
=if(PeriodSortOrder = Max(TOTAL {<PeriodCat={'Full*'}>}PeriodSortOrder),NUM(sum({<PeriodCat={'Full*'}>}Expression1)/before(Column(1)),'##.#0%'),sum({<PeriodCat={'Full*'}>}Expression1))
Use below to show total for first year and percentages for trailing years
=if(PeriodSortOrder = MIN(TOTAL {<Period={'FY*'}>}PeriodSortOrder),sum({<PeriodCat={'Full*'}>}Expression1)
,sum({<PeriodCat={'Full*'}>}Expression1) / before(sum({<PeriodCat={'Full*'}>}Expression1))
)
- Move Comment
- Delete Comment
- Mark as Read
- Mark as New
- Bookmark
- Permalink
- Report Inappropriate Content
Thanks, that worked wonders for the FY. Now I would like to use the "before" function if a user selects YearMonth category to compare with the 12 months before period. For example I would like to calculate growth 2016-10 versus 2015-10, 2015-10 versus 2014-10, etc. Which measure would you use? Thanks !
- Move Comment
- Delete Comment
- Mark as Read
- Mark as New
- Bookmark
- Permalink
- Report Inappropriate Content
Hi,
Can I request you to post this as a separate thread , so other community members can also take a look at your query
Thanks
Vineeth
- Move Comment
- Delete Comment
- Mark as Read
- Mark as New
- Bookmark
- Permalink
- Report Inappropriate Content
Thank you for useful information.