Unlock a world of possibilities! Login now and discover the exclusive benefits awaiting you.
- Qlik Community
- :
- Forums
- :
- Analytics
- :
- New to Qlik Analytics
- :
- 100% Stacked bar with aggregate
- Subscribe to RSS Feed
- Mark Topic as New
- Mark Topic as Read
- Float this Topic for Current User
- Bookmark
- Subscribe
- Mute
- Printer Friendly Page
- Mark as New
- Bookmark
- Subscribe
- Mute
- Subscribe to RSS Feed
- Permalink
- Report Inappropriate Content
100% Stacked bar with aggregate
Hi,
I have customer data about their spend TV, Radio and Internet on a specific date, like in this table
| Customer | Mediumtype | Date | Spend |
|---|---|---|---|
| A | TV | 1/1/2016 | € 100 |
| A | TV | 2/1/2016 | € 600 |
| A | Radio | 1/1/2016 | € 250 |
| A | Internet | 3/1/2016 | € 20 |
| B | TV | 1/1/2016 | € 80 |
| B | Radio | 1/1/2016 | € 65 |
I want to make a 100% stacked bar chart per customer split on the mediumtypes. Like this:
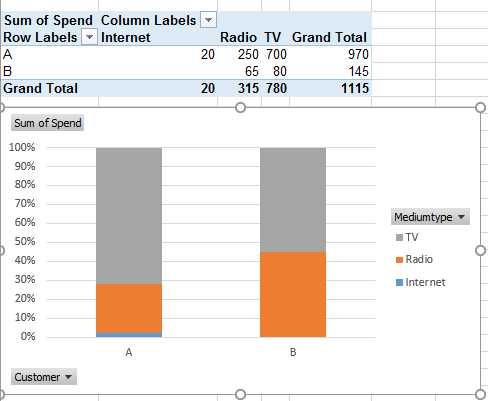
I tried to make an aggregation, but none of these work, it's not adding up to 100%:
sum({<year=2016,"Media Type"=>}Spend)/ aggr(sum({<year=2016,"Media Type"=>}Spend),Customer)
aggr(sum({<year=2016>}Spend), [Media Type], Customer)/ aggr(sum({<year=2016>}Spend), Customer)
sum({<year=2016>}Spend)/ sum(aggr(sum({<year=2016>}Spend), Customer))
sum({<year=2016>}Spend)/ sum(aggr(sum( {<year=2016>}Spend), Customer))
sum({<year=2016>}Spend)/ sum( { total <year=2016>}Spend))
What am I doing wrong? Can you help me?
Thanks!
Kind regards,
Isabelle
Accepted Solutions
- Mark as New
- Bookmark
- Subscribe
- Mute
- Subscribe to RSS Feed
- Permalink
- Report Inappropriate Content
Hi,
Try
=sum({<year={'2016'}>}Spend)/ sum( { <year={'2016'}>} TOTAL <Customer> Spend)
Hope this helps you.
Regards,
Jagan.
- Mark as New
- Bookmark
- Subscribe
- Mute
- Subscribe to RSS Feed
- Permalink
- Report Inappropriate Content
Try sum(Spend)/sum(TOTAL <Mediumtype> Spend)
talk is cheap, supply exceeds demand
- Mark as New
- Bookmark
- Subscribe
- Mute
- Subscribe to RSS Feed
- Permalink
- Report Inappropriate Content
I tried sum(Spend)/sum(TOTAL <Customer> Spend) and that worked perfect!
Thanks!
- Mark as New
- Bookmark
- Subscribe
- Mute
- Subscribe to RSS Feed
- Permalink
- Report Inappropriate Content
Hi,
Try
=sum({<year={'2016'}>}Spend)/ sum( { <year={'2016'}>} TOTAL <Customer> Spend)
Hope this helps you.
Regards,
Jagan.