Unlock a world of possibilities! Login now and discover the exclusive benefits awaiting you.
- Qlik Community
- :
- Forums
- :
- Analytics
- :
- New to Qlik Analytics
- :
- Re: 2 measures trellis-chart
- Subscribe to RSS Feed
- Mark Topic as New
- Mark Topic as Read
- Float this Topic for Current User
- Bookmark
- Subscribe
- Mute
- Printer Friendly Page
- Mark as New
- Bookmark
- Subscribe
- Mute
- Subscribe to RSS Feed
- Permalink
- Report Inappropriate Content
2 measures trellis-chart
Hi,
I am using api trellis-chart to make multiple charts with 2 dimensions with 1 measure but what I want is to have multi measures (> = 2). GitHub - miclae76/trellis-chart: Qlik Sense Trellis Chart Extension
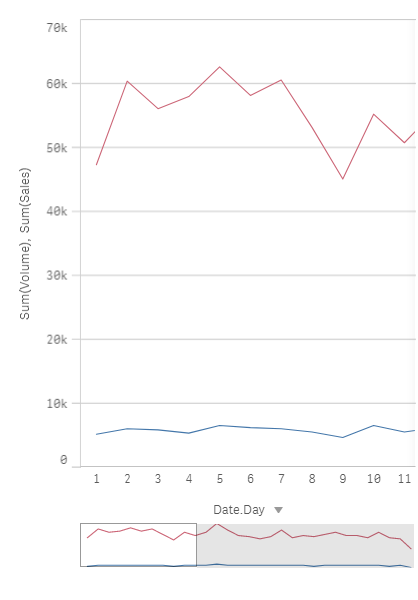
With the native qlik line chart it is possible to have 2 measures on the same chart, but you can only have one dimension.

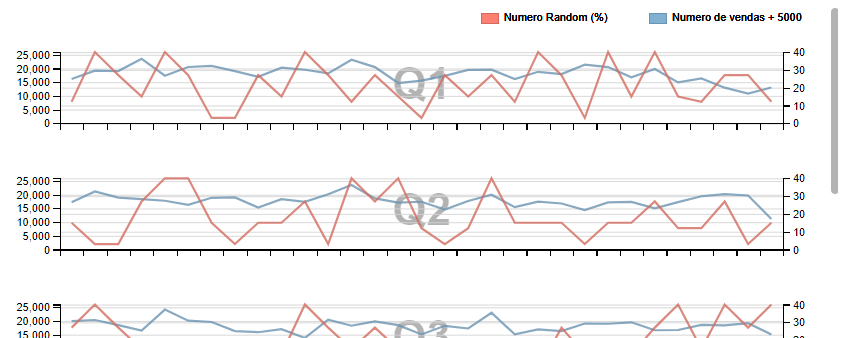
With trellis-chart I can only have one measure (Sum - Sales) but I need 2 measures (Sum - Sales and Sum - Volume).

Is there any way to get 2 measures and 2 dimensions?
- Tags:
- multiple line chart
- « Previous Replies
-
- 1
- 2
- Next Replies »
Accepted Solutions
- Mark as New
- Bookmark
- Subscribe
- Mute
- Subscribe to RSS Feed
- Permalink
- Report Inappropriate Content
- Mark as New
- Bookmark
- Subscribe
- Mute
- Subscribe to RSS Feed
- Permalink
- Report Inappropriate Content
hi André,
I implemented this trellis chart extension, it might be possible , I will have a look to the code asap.
michael
- Mark as New
- Bookmark
- Subscribe
- Mute
- Subscribe to RSS Feed
- Permalink
- Report Inappropriate Content
Hi,
I'm very interested in this outcome too.
Thanks kindly.
- Mark as New
- Bookmark
- Subscribe
- Mute
- Subscribe to RSS Feed
- Permalink
- Report Inappropriate Content
Ok Michael. I appreciate ![]()
- Mark as New
- Bookmark
- Subscribe
- Mute
- Subscribe to RSS Feed
- Permalink
- Report Inappropriate Content
I used 2 series with y1 and y2.

- Mark as New
- Bookmark
- Subscribe
- Mute
- Subscribe to RSS Feed
- Permalink
- Report Inappropriate Content
Hi Andre,
Can you please let me know how you have done this. ? I am also having two measures which i wanted to show in the trellis chart.
- Mark as New
- Bookmark
- Subscribe
- Mute
- Subscribe to RSS Feed
- Permalink
- Report Inappropriate Content
var y1 = myChart.addMeasureAxis("y", "measure1");
var y2 = myChart.addMeasureAxis("y", "measure2");
var lines = myChart.addSeries("name measure 1", dimple.plot.line, [x,y1]);
var lines2 = myChart.addSeries("name measure 2", dimple.plot.line, [x,y2]);
- Mark as New
- Bookmark
- Subscribe
- Mute
- Subscribe to RSS Feed
- Permalink
- Report Inappropriate Content
Hi Andre,
Can you pls share the code that you made on trellis-chart.js?
Thanks!
- Mark as New
- Bookmark
- Subscribe
- Mute
- Subscribe to RSS Feed
- Permalink
- Report Inappropriate Content
Hi André Sousa Silva,
Can you share with the community the code you used in every file of the extension? I would like to have to a trellis chart extension with 2 measures.
Many regards,
MB
- Mark as New
- Bookmark
- Subscribe
- Mute
- Subscribe to RSS Feed
- Permalink
- Report Inappropriate Content
Hi Andre
I was trying to create a trellis chart of 2 measure with the ext but i was not able to select a secondary axis.
Can you share the steps/code to create that?
Thanks.
- « Previous Replies
-
- 1
- 2
- Next Replies »