Unlock a world of possibilities! Login now and discover the exclusive benefits awaiting you.
- Qlik Community
- :
- Forums
- :
- Analytics
- :
- New to Qlik Analytics
- :
- Re: Accumulating count with 2 dimensions
- Subscribe to RSS Feed
- Mark Topic as New
- Mark Topic as Read
- Float this Topic for Current User
- Bookmark
- Subscribe
- Mute
- Printer Friendly Page
- Mark as New
- Bookmark
- Subscribe
- Mute
- Subscribe to RSS Feed
- Permalink
- Report Inappropriate Content
Accumulating count with 2 dimensions
I have an expression to accumulate a count using RangeSum and Above. The issue is that when I add a dimension it no longer performs the RangeSum and Above. I can see why it does not work as when i create a pivot table using the same logic, it does not accumulate the value as it now needs to sum from the right not above. I have trolled through the community but no one seems to have something similar. What am i missing?
- « Previous Replies
-
- 1
- 2
- Next Replies »
Accepted Solutions
- Mark as New
- Bookmark
- Subscribe
- Mute
- Subscribe to RSS Feed
- Permalink
- Report Inappropriate Content
Try this
Aggr(RangeSum(Above(Count({<Date = {'$(=Date(vDayCurrent))'}, System = {'Source'}>} feedId), 0, RowNo())), Portfolio2, (Interval, (NUMERIC)))
- Mark as New
- Bookmark
- Subscribe
- Mute
- Subscribe to RSS Feed
- Permalink
- Report Inappropriate Content
Usually you can use aggr to get both dimensions
try like this:
sum( Aggr (
RangeSum(Above(TOTAL Count({<Date = {'$(=Date(vDayCurrent))'}, System = {'Source'}>} feedId),0,RowNo(TOTAL))),
Dimension2,Dimension1))
- Mark as New
- Bookmark
- Subscribe
- Mute
- Subscribe to RSS Feed
- Permalink
- Report Inappropriate Content
Which way are you trying to accumulate? Going down or going across? For going across you need to use Before()/After() functions instead of Above()/Below() functions and use ColumnNo() instead of RowNo() function
- Mark as New
- Bookmark
- Subscribe
- Mute
- Subscribe to RSS Feed
- Permalink
- Report Inappropriate Content
Tried that the other day and that does not work.
- Mark as New
- Bookmark
- Subscribe
- Mute
- Subscribe to RSS Feed
- Permalink
- Report Inappropriate Content
So I can now get the Pivot table working correctly but when I use the same logic in the line chart I get nothing. What frustrates me with this program is if you can do something in a pivot table why cant one use the same logic for a chart? Too often, I need to adapt the expression again. What is the logic behind this?
- Mark as New
- Bookmark
- Subscribe
- Mute
- Subscribe to RSS Feed
- Permalink
- Report Inappropriate Content
You might see it as restrictive and frustrating, but I see it as making it more intuitive for developers. If you look at this in a pivot table, If you want to accumulate horizontally, would you say that you would want to go above or below? or would saying After and Before would make more sense? Similarly, it is the same logic for ColumnNo() vs RowNo().
To differentiate, pivot table is an exception where After/Before and ColumnNo, else all other objects will need Above/Below and RowNo(). If you really hate After/Before and would like to use Above/Below for even a pivoted dimension of a pivot table, you can use it with Aggr(). Because when you use Aggr(), the imaginary table which it creates is similar to a straight table, the Before/After function stops working. So, now you can use Above/Below.
Read more about After/Before here
- Mark as New
- Bookmark
- Subscribe
- Mute
- Subscribe to RSS Feed
- Permalink
- Report Inappropriate Content
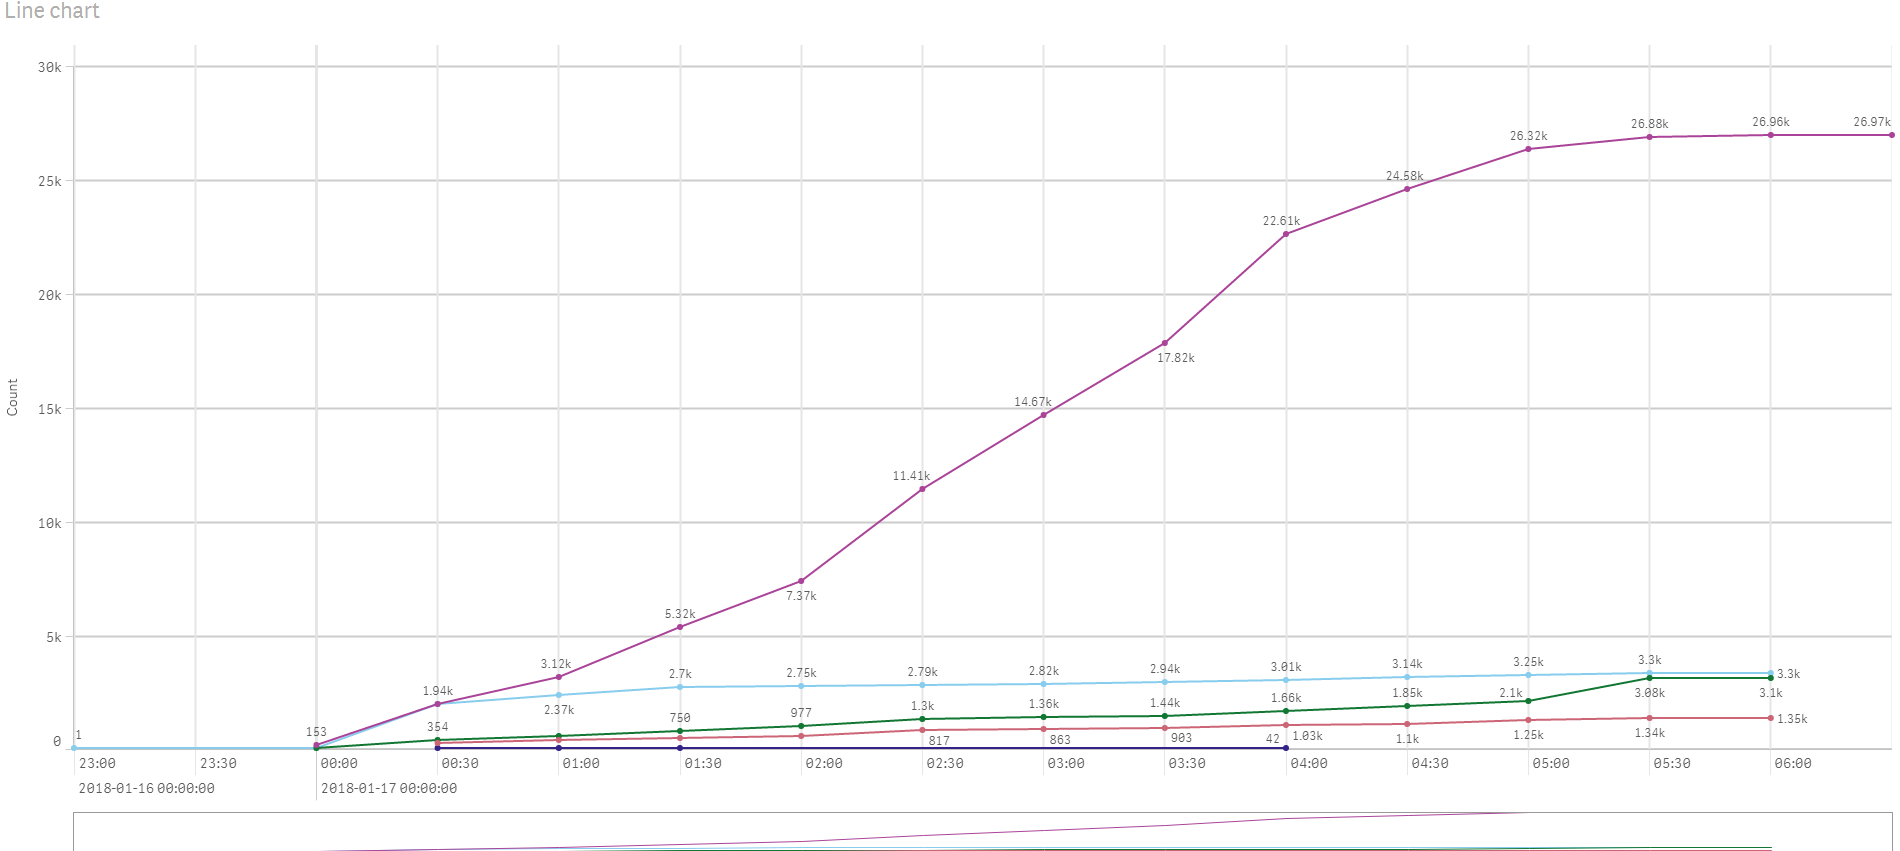
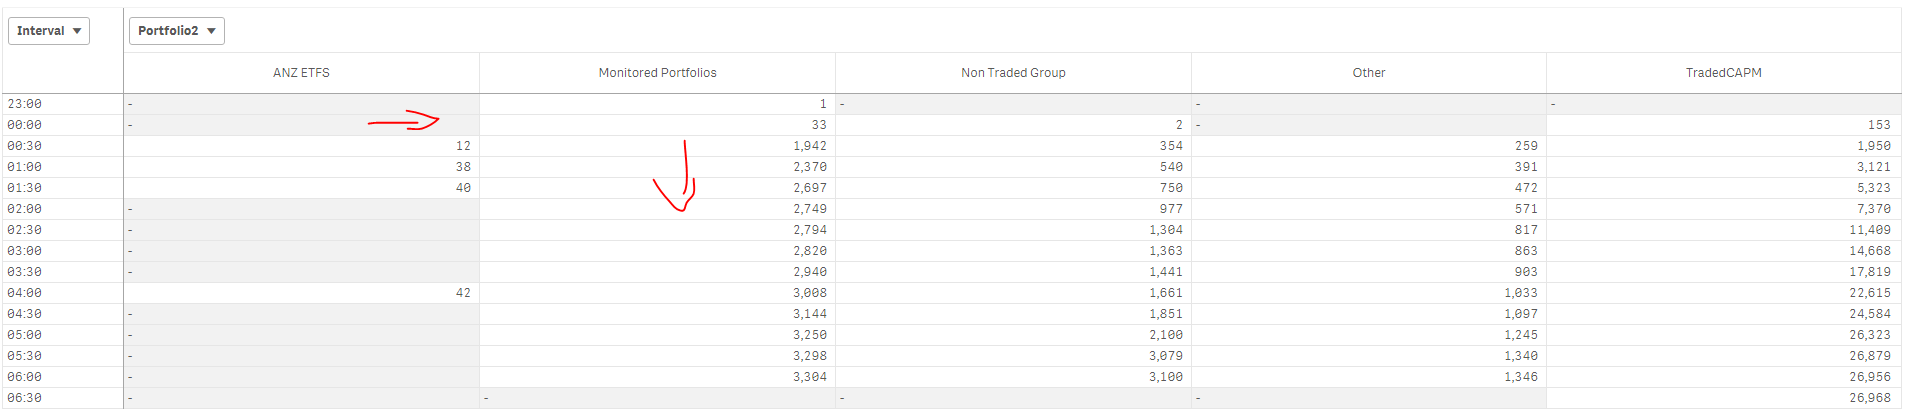
Hi, I really appreciate this as coming from an excel background is different to a developer. However, how do I get my line chart to function correctly though? I used the above and it does not show the expected result like the pivot table.
- Mark as New
- Bookmark
- Subscribe
- Mute
- Subscribe to RSS Feed
- Permalink
- Report Inappropriate Content
This is the code that works for the pivot table but I cannot get it to work for the line chart.
RangeSum(Before(TOTAL Count({<Date = {'$(=Date(vDayCurrent))'}, System = {'Source'}>} feedId),0,ColumnNo(TOTAL)))
I have put aggr around it and taken out TOTAL and nothing seems to work. I dont get the logic differences given it works in a pivot table but not for the line chart.
- Mark as New
- Bookmark
- Subscribe
- Mute
- Subscribe to RSS Feed
- Permalink
- Report Inappropriate Content
Would you be able to share a sample? Might help to see what you have to give a better response
- Mark as New
- Bookmark
- Subscribe
- Mute
- Subscribe to RSS Feed
- Permalink
- Report Inappropriate Content
Here you go
- « Previous Replies
-
- 1
- 2
- Next Replies »