Unlock a world of possibilities! Login now and discover the exclusive benefits awaiting you.
- Qlik Community
- :
- Forums
- :
- Analytics
- :
- New to Qlik Analytics
- :
- Re: Add Up count values
- Subscribe to RSS Feed
- Mark Topic as New
- Mark Topic as Read
- Float this Topic for Current User
- Bookmark
- Subscribe
- Mute
- Printer Friendly Page
- Mark as New
- Bookmark
- Subscribe
- Mute
- Subscribe to RSS Feed
- Permalink
- Report Inappropriate Content
Add Up count values
Hi,
i want to add up count values. I try it like this, but it doesn´t work:
Count({<[prodYear] = {"$(=getfieldselections(Year))"},[prodMonth] = {"Nov"}>}products) + Count({<[prodYear] = {"$(=getfieldselections(Year))"},prodMonth = {"Okt"}>}products)
The dimension in this chart is prodMonth.
My target is to add up allways the number of products for the last three month.
In Sep i want the sum of products for Jul, Aug, Sep
In Okt i want the sum of products for Aug, Sep, Okt
etc.
How can i do it?
regards,
sam
- « Previous Replies
-
- 1
- 2
- Next Replies »
Accepted Solutions
- Mark as New
- Bookmark
- Subscribe
- Mute
- Subscribe to RSS Feed
- Permalink
- Report Inappropriate Content
My bad, forgot to end the set analysis correctly
RangeSum(Above(Count({<[prodYear] = p(Year)>} products), 0, 3))
- Mark as New
- Bookmark
- Subscribe
- Mute
- Subscribe to RSS Feed
- Permalink
- Report Inappropriate Content
May be try like this:
RangeSum(Above(Count({<[prodYear] = p(Year)>} products), 0, 3))
- Mark as New
- Bookmark
- Subscribe
- Mute
- Subscribe to RSS Feed
- Permalink
- Report Inappropriate Content
or this if your months are sorted in descending order
RangeSum(Below(Count({<[prodYear] = p(Year)>} products), 0, 3))
- Mark as New
- Bookmark
- Subscribe
- Mute
- Subscribe to RSS Feed
- Permalink
- Report Inappropriate Content
Thanks. The chart shows no data. There are no expression errors in the editor. Is missing a comma or something? I can´t find the reason.
- Mark as New
- Bookmark
- Subscribe
- Mute
- Subscribe to RSS Feed
- Permalink
- Report Inappropriate Content
My bad, forgot to end the set analysis correctly
RangeSum(Above(Count({<[prodYear] = p(Year)>} products), 0, 3))
- Mark as New
- Bookmark
- Subscribe
- Mute
- Subscribe to RSS Feed
- Permalink
- Report Inappropriate Content
Perfect, now it works, thanks a lot 🙂
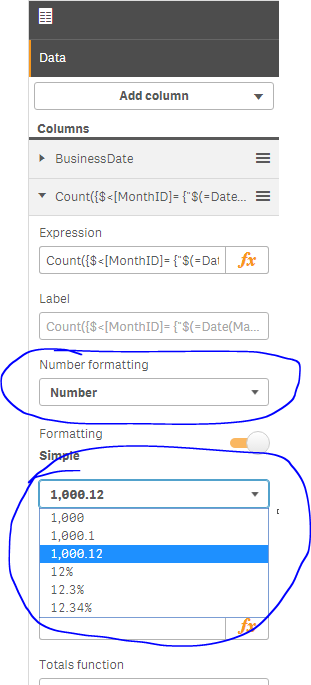
The chart shows always numbers like 30,23k and i want to see the normal number like 30230. So i put this expression in a textfield to see the normal number only for "nov" (sum for sep,okt,nov). But this expression shows 0
RangeSum(Above(Count({<[prodYear] = p(Year), prodMonth = {"Nov"}>} products), 0, 3))
What´s wrong and how can the chart show normal numbers?
regards,
sam
- Mark as New
- Bookmark
- Subscribe
- Mute
- Subscribe to RSS Feed
- Permalink
- Report Inappropriate Content
I guess change your number formatting from here:
- Mark as New
- Bookmark
- Subscribe
- Mute
- Subscribe to RSS Feed
- Permalink
- Report Inappropriate Content
Yes, very easy. I just looked for it and did not find it, but now, thanks one more time again 
- Mark as New
- Bookmark
- Subscribe
- Mute
- Subscribe to RSS Feed
- Permalink
- Report Inappropriate Content
I am glad we were able to figure it out 
- Mark as New
- Bookmark
- Subscribe
- Mute
- Subscribe to RSS Feed
- Permalink
- Report Inappropriate Content
Hi,
i check the data and the sum for each month does not match those of the excel table
My target is to add up allways the number of products for the last three month.
In Sep i want the sum of products for Jul, Aug, Sep
In Okt i want the sum of products for Aug, Sep, Okt
etc.
I use your expression and added "distinct"
RangeSum(Above(Count(Distinct{<[prodYear] = p(Year)>} products), 0, 3))
I create a table, select a month in the chart and check the table of double products. There are double products.
Why? Is "Distinct" wrong in this case or at a wrong position?
regards,
sam
- « Previous Replies
-
- 1
- 2
- Next Replies »