Unlock a world of possibilities! Login now and discover the exclusive benefits awaiting you.
- Qlik Community
- :
- Forums
- :
- Analytics
- :
- New to Qlik Analytics
- :
- Add chart reference line in dd:hh:mm format
- Subscribe to RSS Feed
- Mark Topic as New
- Mark Topic as Read
- Float this Topic for Current User
- Bookmark
- Subscribe
- Mute
- Printer Friendly Page
- Mark as New
- Bookmark
- Subscribe
- Mute
- Subscribe to RSS Feed
- Permalink
- Report Inappropriate Content
Add chart reference line in dd:hh:mm format
Hi. I'm not even sure how to express my question in a way that would return search results so I figured I'd ask it here.
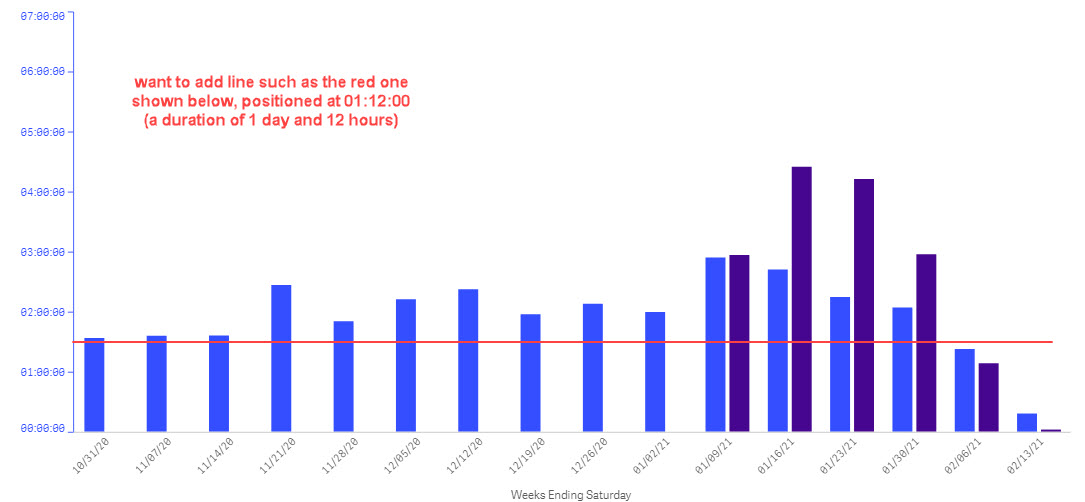
The ask: How can I add a reference line to be positioned at 01:12:00 (a duration interval of 1 day and 12 hours) to the chart (see screenshot)?
Relevant info: I have a chart that compares the average time it takes to resolve incident tickets where the duration is displayed as dd:hh:mm. The formulas used to achieve that result are:
interval(avg({$<IncOpenedBySD = {'Yes'}> * $<IncAssignedToCompany = {"*CompanyA*"}>} IncTimeToResolve)/1440,'DD:hh:mm')
interval(avg({$<IncOpenedBySD = {'Yes'}> * $<IncAssignedToCompany = {"*CompanyB*"}>} IncTimeToResolve)/1440,'DD:hh:mm')
Those work great and produce the blue and purple bars shown in the image. What I'm trying to do is chart the target duration of 1 day and 12 hours, so that users can see whether or not the companies are hitting above or below the target. I have no idea what to enter in the reference line expression field.
Help?

Accepted Solutions
- Mark as New
- Bookmark
- Subscribe
- Mute
- Subscribe to RSS Feed
- Permalink
- Report Inappropriate Content
I got it! I used some of what Nicole had and figured that since it was an interval, it must want a calculation. So thanks to @Nicole-Smith for leading me in the right direction.
=interval#(2160/1440,'DD:hh:mm')
- Mark as New
- Bookmark
- Subscribe
- Mute
- Subscribe to RSS Feed
- Permalink
- Report Inappropriate Content
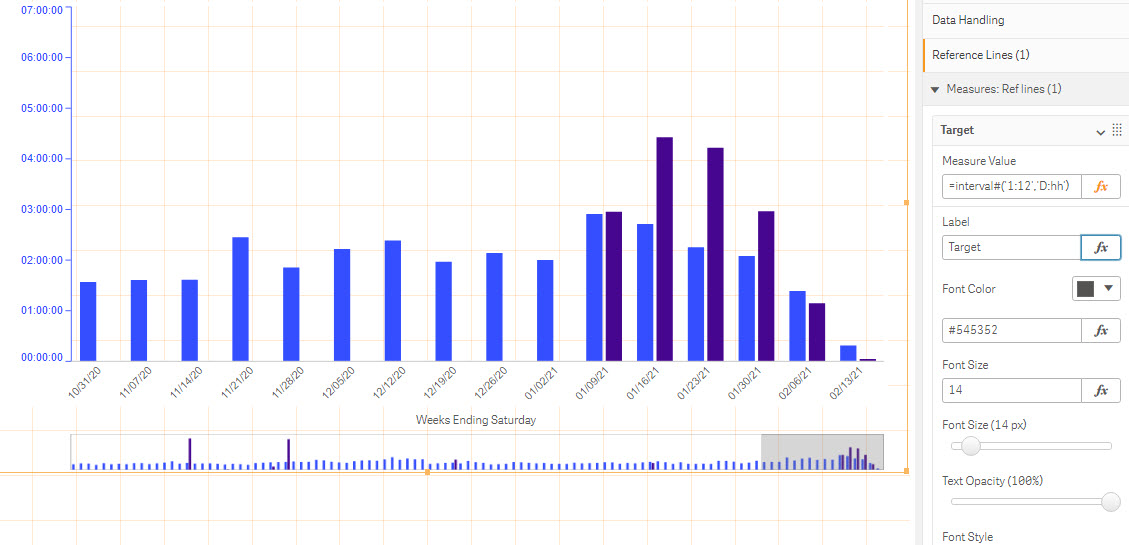
This should work:
=interval#('1:12','D:hh')
- Mark as New
- Bookmark
- Subscribe
- Mute
- Subscribe to RSS Feed
- Permalink
- Report Inappropriate Content
Alas, it did not. It tried to put something in it and then it went away.
- Mark as New
- Bookmark
- Subscribe
- Mute
- Subscribe to RSS Feed
- Permalink
- Report Inappropriate Content
Make sure you click the fx button to open the expression dialog, paste it in, then click OK. I couldn't get it to "stick" either without opening the expression dialog. I have checked that it works :

- Mark as New
- Bookmark
- Subscribe
- Mute
- Subscribe to RSS Feed
- Permalink
- Report Inappropriate Content
It's still not "sticking". 😞 I almost always work in the big dialog box because I don't trust the field (and usually, my formulas are too big to see in the little field).
- Mark as New
- Bookmark
- Subscribe
- Mute
- Subscribe to RSS Feed
- Permalink
- Report Inappropriate Content
My chart is the normal Qlik Sense Bar chart--I don't know what you're using because your options look different. Can you try switching to the same chart as me?
- Mark as New
- Bookmark
- Subscribe
- Mute
- Subscribe to RSS Feed
- Permalink
- Report Inappropriate Content
When I use a regular chart, it does do what it should.
However, what I use are the VizLib extensions. It didn't occur to me that it might require a different formula. I can't switch to a different extension at this point. The entire app is based on VizLib tools.
Any idea how to make it work using that extension?
- Mark as New
- Bookmark
- Subscribe
- Mute
- Subscribe to RSS Feed
- Permalink
- Report Inappropriate Content
I got it! I used some of what Nicole had and figured that since it was an interval, it must want a calculation. So thanks to @Nicole-Smith for leading me in the right direction.
=interval#(2160/1440,'DD:hh:mm')