Unlock a world of possibilities! Login now and discover the exclusive benefits awaiting you.
- Qlik Community
- :
- Forums
- :
- Analytics
- :
- New to Qlik Analytics
- :
- Addition of different years data
- Subscribe to RSS Feed
- Mark Topic as New
- Mark Topic as Read
- Float this Topic for Current User
- Bookmark
- Subscribe
- Mute
- Printer Friendly Page
- Mark as New
- Bookmark
- Subscribe
- Mute
- Subscribe to RSS Feed
- Permalink
- Report Inappropriate Content
Addition of different years data
Hi Guys,
I am working with 2 dimensions trying to create a stacked chart. One dimension is year (2016-2018) and the other dimension is product type with a total of 3 products. I want the stacked chart to be an addition of all the years data. For example, the value of Product 1 in the stack should be its total value for the 3 years. There needs to be only one bar/column for all the 3 years combined. How can I achieve this using an expression? Please advice.
Best Regards,
Rony
- Mark as New
- Bookmark
- Subscribe
- Mute
- Subscribe to RSS Feed
- Permalink
- Report Inappropriate Content
Hi,
You can use a normal bar chart with Sum(Value) using both the Years and Product as dimensions. Make sure to select the stacked bar chart option in 'Style' tab.
If you get it the other way around (sorted by years and products as part of stack) you need to change the order of your dimensions.
- Mark as New
- Bookmark
- Subscribe
- Mute
- Subscribe to RSS Feed
- Permalink
- Report Inappropriate Content
Hi,
is that what you are looking for?
- Mark as New
- Bookmark
- Subscribe
- Mute
- Subscribe to RSS Feed
- Permalink
- Report Inappropriate Content
Hi Niclas and Mateusz,
That is not what I am looking for. I just want one bar line to be stacked with the 3 products. The value for the respective products should be an addition of 2016, 2017 and 2018 values. Hope my explanation is clear. Please advice.
Best Regards,
Rony
- Mark as New
- Bookmark
- Subscribe
- Mute
- Subscribe to RSS Feed
- Permalink
- Report Inappropriate Content
Hi,
I've no idea what you are looking for. You say bar and line in the same sentence, which are two completely different visualizations. Can you provide us an excel screenshot or something so we understand better?
- Mark as New
- Bookmark
- Subscribe
- Mute
- Subscribe to RSS Feed
- Permalink
- Report Inappropriate Content
If I understood you correctly, then just remove 'Year' or 'Product' from the dimension (depending on what you want to show). The 'sum(amount)' won't change. Generally, the functions refeers to the whole loaded data model, not only for the dimension in chart. The dimension are just for the data vizualization.
- Mark as New
- Bookmark
- Subscribe
- Mute
- Subscribe to RSS Feed
- Permalink
- Report Inappropriate Content
Hi,
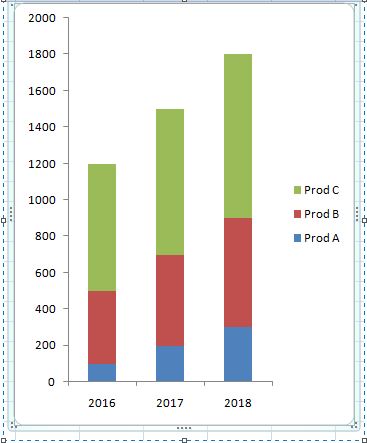
In attached image you will see Prod A,B and C stacked on top of each other for 3 years respectively. I do not want 3 different bars for the 3 different years. I want the values for the 3 different years to be added and shown in 1 bar in the same stacked format.
Regards,
Rony
- Mark as New
- Bookmark
- Subscribe
- Mute
- Subscribe to RSS Feed
- Permalink
- Report Inappropriate Content
Add a calculated dimension or some other dimension which is the same for all the products.
- Mark as New
- Bookmark
- Subscribe
- Mute
- Subscribe to RSS Feed
- Permalink
- Report Inappropriate Content
Hi Mateusz,
Any idea how the expression would be in this case?
Regards,
Rony