Unlock a world of possibilities! Login now and discover the exclusive benefits awaiting you.
- Qlik Community
- :
- Forums
- :
- Analytics
- :
- New to Qlik Analytics
- :
- Re: Aggregate to be used in the chart
- Subscribe to RSS Feed
- Mark Topic as New
- Mark Topic as Read
- Float this Topic for Current User
- Bookmark
- Subscribe
- Mute
- Printer Friendly Page
- Mark as New
- Bookmark
- Subscribe
- Mute
- Subscribe to RSS Feed
- Permalink
- Report Inappropriate Content
Aggregate to be used in the chart
Hi guys,
I have something very simple, but I cannot get the result. Below is the screenshot of the table. I need to calculate total # of hours to be used for my time series graph to be divided by the # of containers (this year)
Something like
count({<[TimeStamp.Calendar.Year] = {"$(=Max({1}[TimeStamp.Calendar.year]))"}>}CNTR_NUM)
/sum(aggr(((EST_DPTR_D-VSL_BERTH_D) *24)),VESSEL_VISIT_C )
So, for the example below it should be 14 / (7.2 + 6.2) = 1.0447761194029850746268656716418.
| VESSEL_VISIT_C | EST_DPTR_D | VSL_BERTH_D | CNTR_NUM |
| 1 | 2018-10-22 22:12:00 | 2018-10-22 15:00:00 | 1593364 |
| 1 | 2018-10-22 22:12:00 | 2018-10-22 15:00:00 | 1635264 |
| 1 | 2018-10-22 22:12:00 | 2018-10-22 15:00:00 | 1762778 |
| 1 | 2018-10-22 22:12:00 | 2018-10-22 15:00:00 | 6057661 |
| 1 | 2018-10-22 22:12:00 | 2018-10-22 15:00:00 | APHU7202885 |
| 1 | 2018-10-22 22:12:00 | 2018-10-22 15:00:00 | APZU2132290 |
| 1 | 2018-10-22 22:12:00 | 2018-10-22 15:00:00 | APZU3457448 |
| 1 | 2018-10-22 22:12:00 | 2018-10-22 15:00:00 | BMOU1102734 |
| 2 | 2018-10-22 21:12:00 | 2018-10-22 15:00:00 | BMOU1288070 |
| 2 | 2018-10-22 21:12:00 | 2018-10-22 15:00:00 | BMOU5899415 |
| 2 | 2018-10-22 21:12:00 | 2018-10-22 15:00:00 | AMFU3206555 |
| 2 | 2018-10-22 21:12:00 | 2018-10-22 15:00:00 | APHU6724720 |
| 2 | 2018-10-22 21:12:00 | 2018-10-22 15:00:00 | APZU3190222 |
| 2 | 2018-10-22 21:12:00 | 2018-10-22 15:00:00 | APZU3677870 |
Many thanks, as usual!
- « Previous Replies
- Next Replies »
- Mark as New
- Bookmark
- Subscribe
- Mute
- Subscribe to RSS Feed
- Permalink
- Report Inappropriate Content
I am not sure I understand the issue... would you be able to show via data or share a sample?
- Mark as New
- Bookmark
- Subscribe
- Mute
- Subscribe to RSS Feed
- Permalink
- Report Inappropriate Content
Thank you for the responses! I have updated the vessel xls attached to the original post - basically duplicated some rows from the January 2017 but changed the year to 2018.
- Mark as New
- Bookmark
- Subscribe
- Mute
- Subscribe to RSS Feed
- Permalink
- Report Inappropriate Content
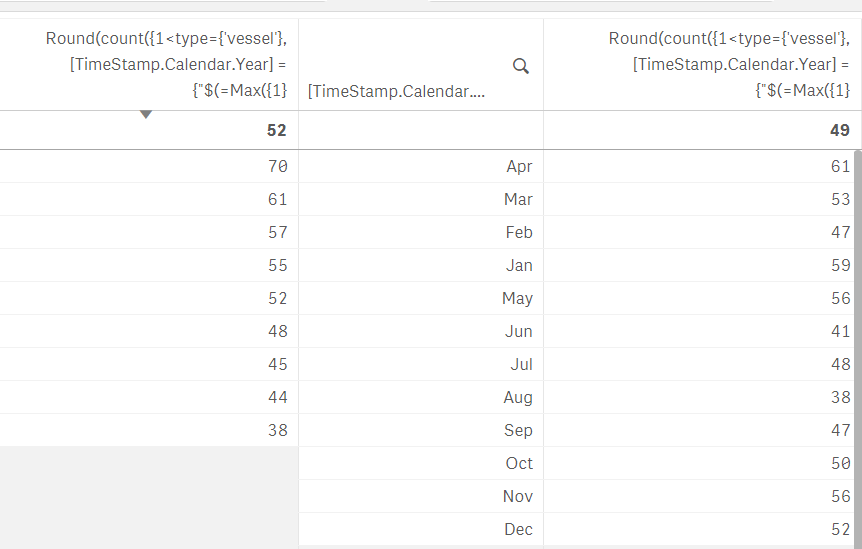
The weird part is that if you create table and use the formula below to calculate the last year metric, it is shown in the tbl but it's not show on the graph.
Round(count({1<type={'vessel'}, [TimeStamp.Calendar.Year] = {"$(=Max({1}[TimeStamp.Calendar.year])-1)"}>}container)
/
Sum({1}Aggr(((Only({1<type={'vessel'}, [TimeStamp.Calendar.Year] = {"$(=Max({1}[TimeStamp.Calendar.year])-1)"}>}TimeStamp)-Only({1} VSL_BERTH_D))*24), visit, [TimeStamp.Calendar.Month])))

- Mark as New
- Bookmark
- Subscribe
- Mute
- Subscribe to RSS Feed
- Permalink
- Report Inappropriate Content
Annd I have it, I just converted the table to the graph. Beautiful graph! Thank you, Sunny!
Thank you, Sunny! Sunny, I know I am pain in the neck, but could you, please, take at look at Ignore date selection from calendar but not other filters?
So far I have seen on the forum that some people here are experts in data models, some, in formulas. You seem to belong to the latter.
- « Previous Replies
- Next Replies »