Unlock a world of possibilities! Login now and discover the exclusive benefits awaiting you.
- Qlik Community
- :
- Forums
- :
- Analytics
- :
- New to Qlik Analytics
- :
- Re: Aggregation to show a relative percentage to t...
- Subscribe to RSS Feed
- Mark Topic as New
- Mark Topic as Read
- Float this Topic for Current User
- Bookmark
- Subscribe
- Mute
- Printer Friendly Page
- Mark as New
- Bookmark
- Subscribe
- Mute
- Subscribe to RSS Feed
- Permalink
- Report Inappropriate Content
Aggregation to show a relative percentage to the total
Hello,
I have a problem with using a aggregation for constructing a relative percentage of the row value tot the total of the rowvalues.
I have uploaded a data file and a qvw file with a exeample to make it clear.
You will find some dimensions and data columns in the data file.
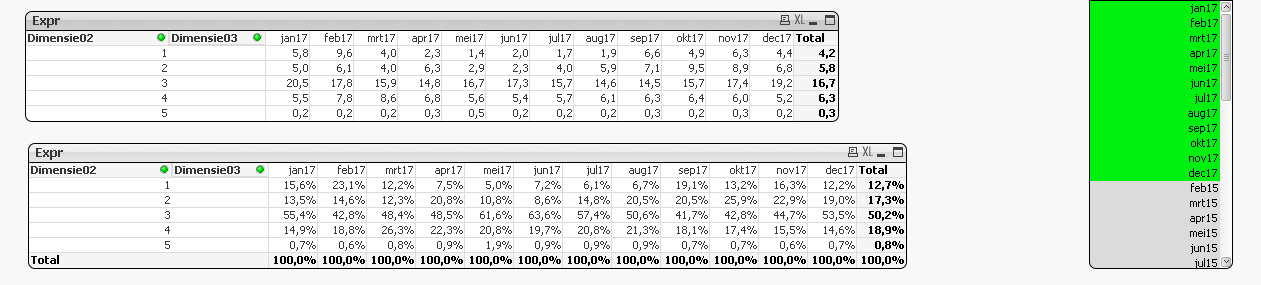
In the added screenshots of the app is the month apr17 selected.
The problem is that the value of the aggegation expressions is shown only on the total row or on one row of the table that is selected.
(see screenshot)
Clicking on another row makes the aggrgation appear at this row.(see screenshot ).

Any suggestions ? Thanks for your help in advance.
Regards
Wim Steskens
- « Previous Replies
-
- 1
- 2
- Next Replies »
- Mark as New
- Bookmark
- Subscribe
- Mute
- Subscribe to RSS Feed
- Permalink
- Report Inappropriate Content
I am a little confused, what exactly are you trying to get? Can you share the expected output in an Excel file for me?
- Mark as New
- Bookmark
- Subscribe
- Mute
- Subscribe to RSS Feed
- Permalink
- Report Inappropriate Content
Sunny,
Sorry that I confused you, that wasn’t my goal. ☺
I attached a Excell-file.
The goal is to have a pivot table like the last one in the Excell-file (background is yellow).
with celvalues per months (=dimension03 in the previous qvw-file) per Verzuimduurklasse (=dimension03 in the previous qvw-files)
The celvalue is the relative percentage of the value of Expr divided by Agr (colums in the previous qvw-files).
This is not a problem.
The problem is to also show the total of the celvalue ( %rel) over the selected months.
Hope this makes it clear.
Regards,
Wim Steskens
Van: Sunny Talwar
Verzonden: woensdag 18 april 2018 10:58
Aan: W.H.M. (Wim) Steskens <w.steskens@leeuwenborgh.nl>
Onderwerp: Re: - Aggregation to show a relative percentage to the total
- Mark as New
- Bookmark
- Subscribe
- Mute
- Subscribe to RSS Feed
- Permalink
- Report Inappropriate Content
Here you go 
- Mark as New
- Bookmark
- Subscribe
- Mute
- Subscribe to RSS Feed
- Permalink
- Report Inappropriate Content
Sunny,
That’s it what I was looking for.
Thanks again for your great help.
Regards,
Wim Steskens
Van: Sunny Talwar
Verzonden: woensdag 18 april 2018 13:40
Aan: W.H.M. (Wim) Steskens <w.steskens@leeuwenborgh.nl>
Onderwerp: Re: - Aggregation to show a relative percentage to the total
- Mark as New
- Bookmark
- Subscribe
- Mute
- Subscribe to RSS Feed
- Permalink
- Report Inappropriate Content
I am glad I was able to help.
Best,
Sunny
- « Previous Replies
-
- 1
- 2
- Next Replies »