Unlock a world of possibilities! Login now and discover the exclusive benefits awaiting you.
Announcements
Introducing Qlik Answers: A plug-and-play, Generative AI powered RAG solution.
READ ALL ABOUT IT!
- Qlik Community
- :
- Forums
- :
- Analytics
- :
- New to Qlik Analytics
- :
- Applying Log scale to axis in Bar chart in Qliksen...
Options
- Subscribe to RSS Feed
- Mark Topic as New
- Mark Topic as Read
- Float this Topic for Current User
- Bookmark
- Subscribe
- Mute
- Printer Friendly Page
Turn on suggestions
Auto-suggest helps you quickly narrow down your search results by suggesting possible matches as you type.
Showing results for
Creator III
2017-04-12
08:37 AM
- Mark as New
- Bookmark
- Subscribe
- Mute
- Subscribe to RSS Feed
- Permalink
- Report Inappropriate Content
Applying Log scale to axis in Bar chart in Qliksense
Hi,
I want to apply log scale to Bar chart in Qliksense. Because refer below image, in image first bar lenght is large and other bars lenght is short. I need to make lenght look similar without data change. Its like how it happens in line chart after applying log scale. It works perfectly in line chart but not in bar chart.
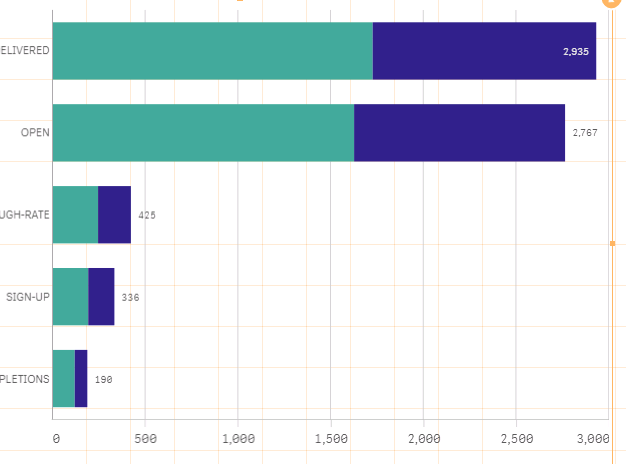
How could i apply that? Is there any other extension avaliable to achieve this goal? Any suggestion/idea/workaround are all appreciated.
- Tags:
- chart bar
1,045 Views
0 Replies
Community Browser