Unlock a world of possibilities! Login now and discover the exclusive benefits awaiting you.
- Qlik Community
- :
- Forums
- :
- Analytics
- :
- New to Qlik Analytics
- :
- Applying custom colors for bar graph in qliksense
- Subscribe to RSS Feed
- Mark Topic as New
- Mark Topic as Read
- Float this Topic for Current User
- Bookmark
- Subscribe
- Mute
- Printer Friendly Page
- Mark as New
- Bookmark
- Subscribe
- Mute
- Subscribe to RSS Feed
- Permalink
- Report Inappropriate Content
Applying custom colors for bar graph in qliksense
Hi,
I am trying to apply custom colors for bars in bar graph.
my expression for each bar in graph is below
1.)sum(vegetables)/sum(groceries)
2.)sum(fruits)/sum(groceries)
3.)sum(bananas)/sum(groceries)
How could i apply different custom colors to these bars.Please help me on this.
- Tags:
- bar graph
- « Previous Replies
-
- 1
- 2
- Next Replies »
- Mark as New
- Bookmark
- Subscribe
- Mute
- Subscribe to RSS Feed
- Permalink
- Report Inappropriate Content
try
=if(sum(vegetables)/sum(groceries),Red(),Green())
- Mark as New
- Bookmark
- Subscribe
- Mute
- Subscribe to RSS Feed
- Permalink
- Report Inappropriate Content
Hi
thanks for reply,
Where should i apply this,
in data or Appearenc?
- Mark as New
- Bookmark
- Subscribe
- Mute
- Subscribe to RSS Feed
- Permalink
- Report Inappropriate Content
Hi,
apply it in the background color.
- Mark as New
- Bookmark
- Subscribe
- Mute
- Subscribe to RSS Feed
- Permalink
- Report Inappropriate Content
can you share the app?
- Mark as New
- Bookmark
- Subscribe
- Mute
- Subscribe to RSS Feed
- Permalink
- Report Inappropriate Content
Hi,
i have attached snippet of my work
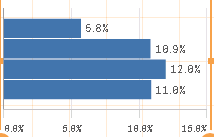
here i have expression for different bars, how could i apply color for this each bars.
- Mark as New
- Bookmark
- Subscribe
- Mute
- Subscribe to RSS Feed
- Permalink
- Report Inappropriate Content
Hi,
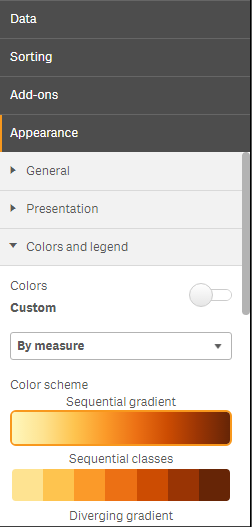
You can go to the chart properties. Follow below steps
1. use Edit Mode
2. Click on Bar Chart
3. on the right panel, click on Appearance > Colors and legend
4. switch on the custom Colors and then select By measure on the dropdown option
- Mark as New
- Bookmark
- Subscribe
- Mute
- Subscribe to RSS Feed
- Permalink
- Report Inappropriate Content
hi
try below
- Mark as New
- Bookmark
- Subscribe
- Mute
- Subscribe to RSS Feed
- Permalink
- Report Inappropriate Content
HI,
here i have 3 bars with different 3 condition(expression) , how could i use my above code in expression.
Please help me on this.
- Mark as New
- Bookmark
- Subscribe
- Mute
- Subscribe to RSS Feed
- Permalink
- Report Inappropriate Content
can u share qvf? orelse share ur expresions?
- « Previous Replies
-
- 1
- 2
- Next Replies »