Unlock a world of possibilities! Login now and discover the exclusive benefits awaiting you.
- Qlik Community
- :
- Forums
- :
- Analytics
- :
- New to Qlik Analytics
- :
- Re: Assigning Specific Colors to Measures
- Subscribe to RSS Feed
- Mark Topic as New
- Mark Topic as Read
- Float this Topic for Current User
- Bookmark
- Subscribe
- Mute
- Printer Friendly Page
- Mark as New
- Bookmark
- Subscribe
- Mute
- Subscribe to RSS Feed
- Permalink
- Report Inappropriate Content
Assigning Specific Colors to Measures
Hello qlik friends,
I am having an issue with assigning colors to measures within Qlik sense. Important note: I have no editing access to the master Item colors for measures, and the measures are not a field but a long formula.
In order to get around it I assume I would need to use Qlik expressions, how would I go about assigning this graph's colors (attached is an example of the formula that is a measure).
thanks all!
Ken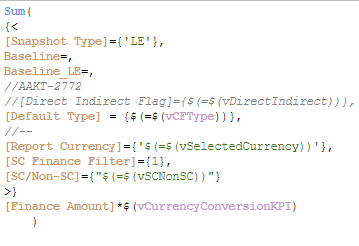
- Mark as New
- Bookmark
- Subscribe
- Mute
- Subscribe to RSS Feed
- Permalink
- Report Inappropriate Content
You can calculate a color number out of the expected possible value range of the expression you have.
For instance if an expression yields typically values between 5000 and 10000 you can adapt this to colors between 1 and 5. That would be simply to divide by 1000 and subtract 4. This would be a static way of doing it that might work well for a lot of cases. You could to it dynamically by finding the max value of the expression over the range of dimension values you will use either out of context of the chart which would be semi-dynamic or directly in the context of the chart completely dynamic. The complexity to achieve this increase with the level of dynamism...
So for the simple static case I mentioned above you would have:
Color( Sum(....... ) / 1000 - 4 )
as a color expression.
- Mark as New
- Bookmark
- Subscribe
- Mute
- Subscribe to RSS Feed
- Permalink
- Report Inappropriate Content
thanks for the reply. I think my ranges are too big for this idea, but I appreciate the reply, I will look into it!
- Mark as New
- Bookmark
- Subscribe
- Mute
- Subscribe to RSS Feed
- Permalink
- Report Inappropriate Content
Please go through the below link, it may be helpful.
Qlik Sense Color Range Theme Approach
The approach aims to use an expression that doesn't need to be rewritten each time the measure changes and can be copied across different objects without changes.
- Mark as New
- Bookmark
- Subscribe
- Mute
- Subscribe to RSS Feed
- Permalink
- Report Inappropriate Content
This does not appear to be a public location. sibin.jacob can you either ask the moderator to open it up or make a copy of the content for the rest of us?
Thanks
- Mark as New
- Bookmark
- Subscribe
- Mute
- Subscribe to RSS Feed
- Permalink
- Report Inappropriate Content
I am seeing the same error.
- Mark as New
- Bookmark
- Subscribe
- Mute
- Subscribe to RSS Feed
- Permalink
- Report Inappropriate Content
I am not able to see that document now.
The same logic applied in another document and sample file also available in the below link.