Unlock a world of possibilities! Login now and discover the exclusive benefits awaiting you.
- Qlik Community
- :
- Forums
- :
- Analytics
- :
- New to Qlik Analytics
- :
- Average calculation
- Subscribe to RSS Feed
- Mark Topic as New
- Mark Topic as Read
- Float this Topic for Current User
- Bookmark
- Subscribe
- Mute
- Printer Friendly Page
- Mark as New
- Bookmark
- Subscribe
- Mute
- Subscribe to RSS Feed
- Permalink
- Report Inappropriate Content
Average calculation
Hi friends,
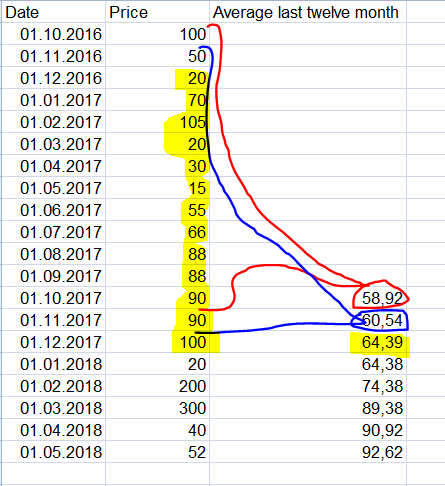
I would like to calculate the average of the last 12 month (starting with 01.10.2017) and show them in a bar chart.
Can anyone help me with a formula to make it work like in my screenshot.
So the average from 01.10.2016 - 01.10.2017 would be 58,92 (red)
the average from 01.11.2016 - 01.11.2017 would be 60,54 (blue)
the average from 01.12.2016 - 01.12.2017 would be 54,39 (yellow)
and so on...
Thank you for any help!
markus
Accepted Solutions
- Mark as New
- Bookmark
- Subscribe
- Mute
- Subscribe to RSS Feed
- Permalink
- Report Inappropriate Content
Hi,
try this:
=RangeAvg(Above(sum(Price),0,12))
if it gives you correct values, you can set an if condition to start the calculation from 01/10/2017
- Mark as New
- Bookmark
- Subscribe
- Mute
- Subscribe to RSS Feed
- Permalink
- Report Inappropriate Content
Hi Markus,
Look at this article for some insights;
FYI, You are actually marking 13 months in Your illustration so You are actually doing calculation of 13 month rollling averages with those formulas which will throw You off if You compare to Sense formulas calculating 12 month rolling averages - like Rangeavg(Above(sum(Price),0,12)).
Best Regards
Lucke
- Mark as New
- Bookmark
- Subscribe
- Mute
- Subscribe to RSS Feed
- Permalink
- Report Inappropriate Content
Hi,
try this:
=RangeAvg(Above(sum(Price),0,12))
if it gives you correct values, you can set an if condition to start the calculation from 01/10/2017
- Mark as New
- Bookmark
- Subscribe
- Mute
- Subscribe to RSS Feed
- Permalink
- Report Inappropriate Content
Thank you Youssef!
It works exactly as I wanted to!
Best
Markus
- Mark as New
- Bookmark
- Subscribe
- Mute
- Subscribe to RSS Feed
- Permalink
- Report Inappropriate Content
you're welcome, don't forget to close the thread