Unlock a world of possibilities! Login now and discover the exclusive benefits awaiting you.
- Qlik Community
- :
- Forums
- :
- Analytics
- :
- New to Qlik Analytics
- :
- Re: Bar Chart : 3 Dimensions and 1 measure
- Subscribe to RSS Feed
- Mark Topic as New
- Mark Topic as Read
- Float this Topic for Current User
- Bookmark
- Subscribe
- Mute
- Printer Friendly Page
- Mark as New
- Bookmark
- Subscribe
- Mute
- Subscribe to RSS Feed
- Permalink
- Report Inappropriate Content
Bar Chart : 3 Dimensions and 1 measure
Hi,
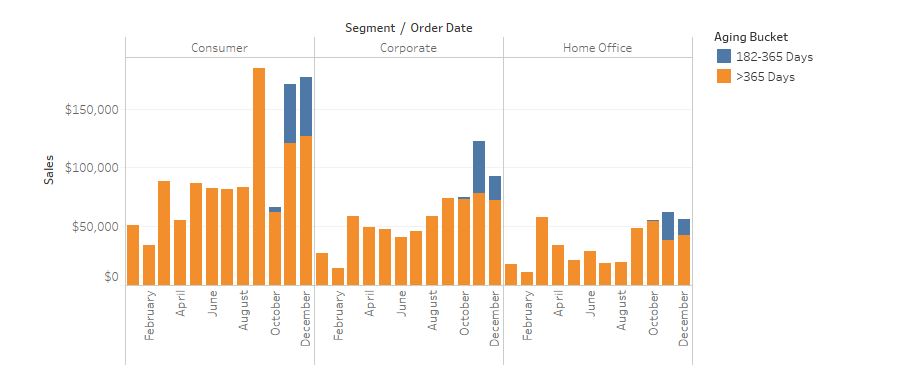
I want a bar chart with 3 dimensions (A,B,C)and 1 measure.
It should be like , for each of the A dimension values I need different bars for B.And the measure in the bar should be split (stacked) according to dimension C.
Please help me on this
- « Previous Replies
-
- 1
- 2
- Next Replies »
- Mark as New
- Bookmark
- Subscribe
- Mute
- Subscribe to RSS Feed
- Permalink
- Report Inappropriate Content
can you explain this with a drawn image image?
- Mark as New
- Bookmark
- Subscribe
- Mute
- Subscribe to RSS Feed
- Permalink
- Report Inappropriate Content
Hi Omar,
I am unable to upload the image here.. it's showing 'Image type is forbidden'. Any other way to share the image?
- Mark as New
- Bookmark
- Subscribe
- Mute
- Subscribe to RSS Feed
- Permalink
- Report Inappropriate Content
do a screen shot of your image maybe?
and then use this to upload it :

- Mark as New
- Bookmark
- Subscribe
- Mute
- Subscribe to RSS Feed
- Permalink
- Report Inappropriate Content
- Mark as New
- Bookmark
- Subscribe
- Mute
- Subscribe to RSS Feed
- Permalink
- Report Inappropriate Content
Good, can you share a test excel file containing this data (some test data) or maybe a test app to work on it?
Thanks
- Mark as New
- Bookmark
- Subscribe
- Mute
- Subscribe to RSS Feed
- Permalink
- Report Inappropriate Content
Hi Omar,
I have used this sheet to create the sample report.
- Mark as New
- Bookmark
- Subscribe
- Mute
- Subscribe to RSS Feed
- Permalink
- Report Inappropriate Content
Hi Faris,
Create a bar chart with 2 dimension and one measure. After that, color the bar chart using the third dimension(use 'Color by dimension' in Color and legend tab) or use color by expression(using the third dimension for custom coloring).
- Mark as New
- Bookmark
- Subscribe
- Mute
- Subscribe to RSS Feed
- Permalink
- Report Inappropriate Content
HI Jeshwin,
Even then I am not getting it properly in a stacked bar. If possible, can you please send me a sample qvf ?
- Mark as New
- Bookmark
- Subscribe
- Mute
- Subscribe to RSS Feed
- Permalink
- Report Inappropriate Content
I just had this issue and found a solution that worked for me:
1 - Create your bar chart with the 3 dimensions and 1 measure
2 - Make sure your most outward dimension (if you are doing year/month/week, it would be year) is listed first.
3 - On the 'Dimensions' page, click the 'Trellis' button.
4 - If you have a fixed number of years (or first dimensions) this will work best, but now check 'Enable Trellis Chart', then for number of columns, select your fixed number, and number of rows, select 1.
Hope this helps!
- « Previous Replies
-
- 1
- 2
- Next Replies »