Unlock a world of possibilities! Login now and discover the exclusive benefits awaiting you.
- Qlik Community
- :
- Forums
- :
- Analytics
- :
- New to Qlik Analytics
- :
- Bar Chart: How to Define Color's Bar Based on Its ...
Options
- Subscribe to RSS Feed
- Mark Topic as New
- Mark Topic as Read
- Float this Topic for Current User
- Bookmark
- Subscribe
- Mute
- Printer Friendly Page
Turn on suggestions
Auto-suggest helps you quickly narrow down your search results by suggesting possible matches as you type.
Showing results for
Contributor III
2015-09-30
03:01 PM
- Mark as New
- Bookmark
- Subscribe
- Mute
- Subscribe to RSS Feed
- Permalink
- Report Inappropriate Content
Bar Chart: How to Define Color's Bar Based on Its Value?
Hi there!
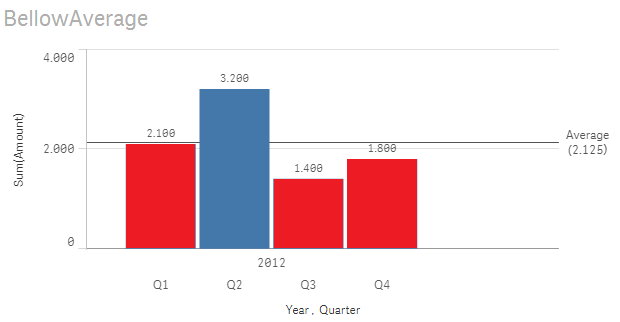
I created a Bar Chart using the following data source:
AggregationScope:
LOAD * inline [
Year Quarter Amount
2012 Q1 1100
2012 Q1 1000
2012 Q2 1700
2012 Q2 1500
2012 Q3 1400
2012 Q4 1800
2013 Q1 1000
2013 Q2 1300
2013 Q3 1100
2013 Q3 900
2013 Q4 1400] (delimiter is ' ');
I added a reference line to Bar Chart based on this expression (I wanted to create an average line): Sum(Amount)/Count(Distinct Quarter)
Now, if total Amount in any Quarter is bellow the average, I want for format its bar with red color.
If ( Amount < Average , RGB(204,102,119),RGB(68,119,170) )
Can you help, please?
Best regards,
Ciro.
174 Views
0 Replies
Community Browser