Unlock a world of possibilities! Login now and discover the exclusive benefits awaiting you.
- Qlik Community
- :
- Forums
- :
- Analytics
- :
- New to Qlik Analytics
- :
- Re: Bar chart in qlik sense
- Subscribe to RSS Feed
- Mark Topic as New
- Mark Topic as Read
- Float this Topic for Current User
- Bookmark
- Subscribe
- Mute
- Printer Friendly Page
- Mark as New
- Bookmark
- Subscribe
- Mute
- Subscribe to RSS Feed
- Permalink
- Report Inappropriate Content
Bar chart in qlik sense
hi all,
suppose i have 10 suppliers as dimension, their rownum in filter pane,
if i select rownum 5 in filter pane, i am getting only the bar related to that 5 num supplier
what i should get is , when i select 5 , i should get suppliers 1,2,3,4,5, in bar chart
please help me
thank u
- Mark as New
- Bookmark
- Subscribe
- Mute
- Subscribe to RSS Feed
- Permalink
- Report Inappropriate Content
What you are doing through Qlik Associative model is selecting Supplier 5 which is correct functionality.
To get what you want you need to do 2 things
1. Add some set analysis to your measure in your chart to find the max selectable rowrum of the supplier. Something like rownum={"<=MAX($(rownum))"}
2. On your dimension in your chart tick exclude null value then you should be ok.
Hope this helps
Regards
Andy
- Mark as New
- Bookmark
- Subscribe
- Mute
- Subscribe to RSS Feed
- Permalink
- Report Inappropriate Content
Hi andy,
Thank you for the reply, its not working.
- Mark as New
- Bookmark
- Subscribe
- Mute
- Subscribe to RSS Feed
- Permalink
- Report Inappropriate Content
Hello,
In order to to that you should modify your filter pane expression.
Try something like: if(id >= 1 and id <= 5, 'TOP 5')
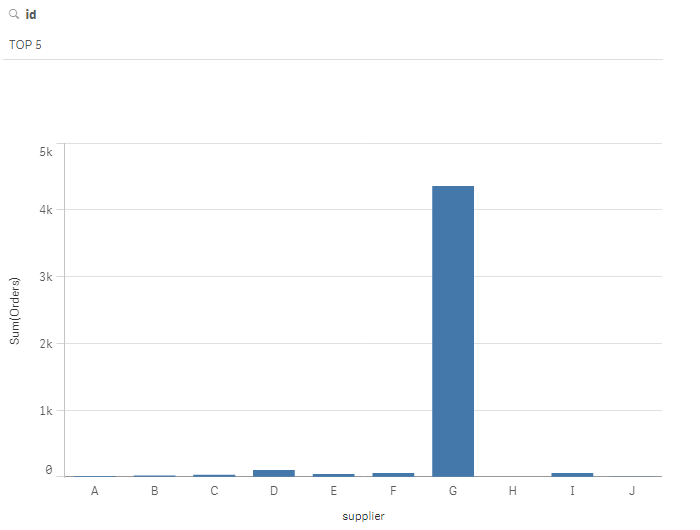
Before selection:
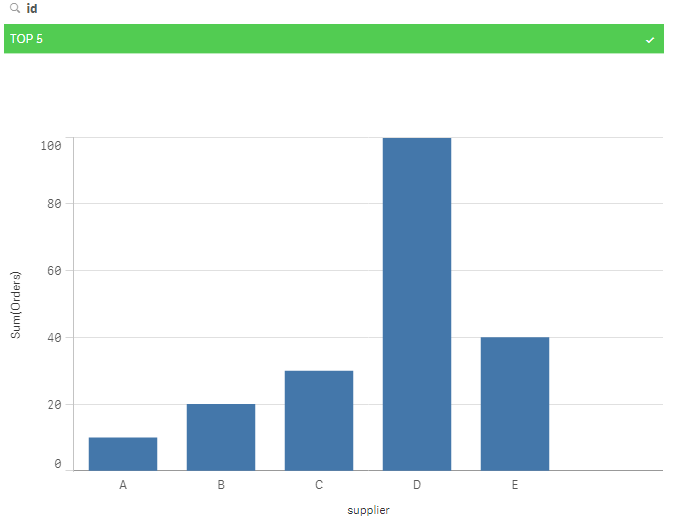
After selection:
I hope it helps,
Estela
- Mark as New
- Bookmark
- Subscribe
- Mute
- Subscribe to RSS Feed
- Permalink
- Report Inappropriate Content
Hi Estela,
Not exactly five, if i select 5 it should shoe me upto 5, if select 7, then it should display me 7, if I un filter all selections , the chart should be as it is.
thank you