Unlock a world of possibilities! Login now and discover the exclusive benefits awaiting you.
- Qlik Community
- :
- Forums
- :
- Analytics
- :
- New to Qlik Analytics
- :
- Re: Bar chart monthly
- Subscribe to RSS Feed
- Mark Topic as New
- Mark Topic as Read
- Float this Topic for Current User
- Bookmark
- Subscribe
- Mute
- Printer Friendly Page
- Mark as New
- Bookmark
- Subscribe
- Mute
- Subscribe to RSS Feed
- Permalink
- Report Inappropriate Content
Bar chart monthly
Hi
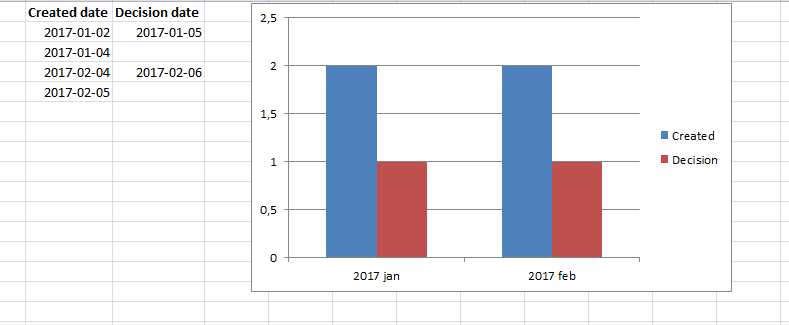
Can someone tell me how to do a bar chart like below. I cant get it right.
- Mark as New
- Bookmark
- Subscribe
- Mute
- Subscribe to RSS Feed
- Permalink
- Report Inappropriate Content
Do you have a calendar? If yes, put your yearmonth as dimension, if not put Monthname([Created date])) as Dimension.
Create two expressions, one for the created date and another one with Decision
The created one should be Count(DISTINCT [Created date])
The decision date one should be similar.
- Mark as New
- Bookmark
- Subscribe
- Mute
- Subscribe to RSS Feed
- Permalink
- Report Inappropriate Content
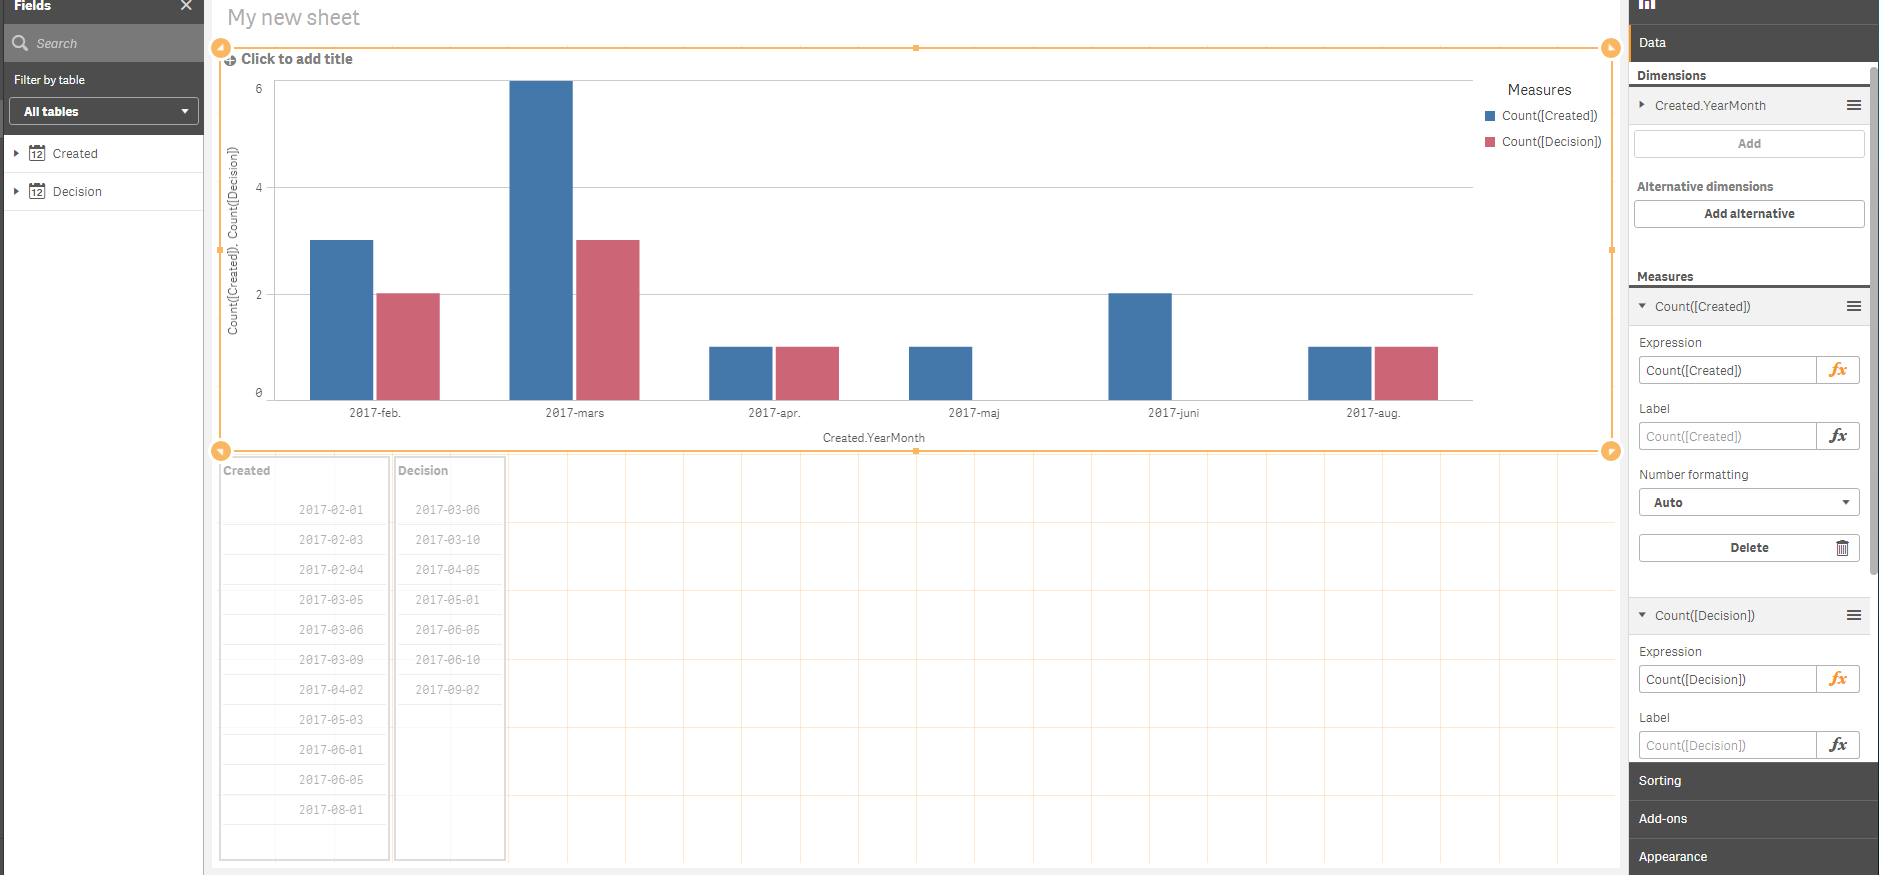
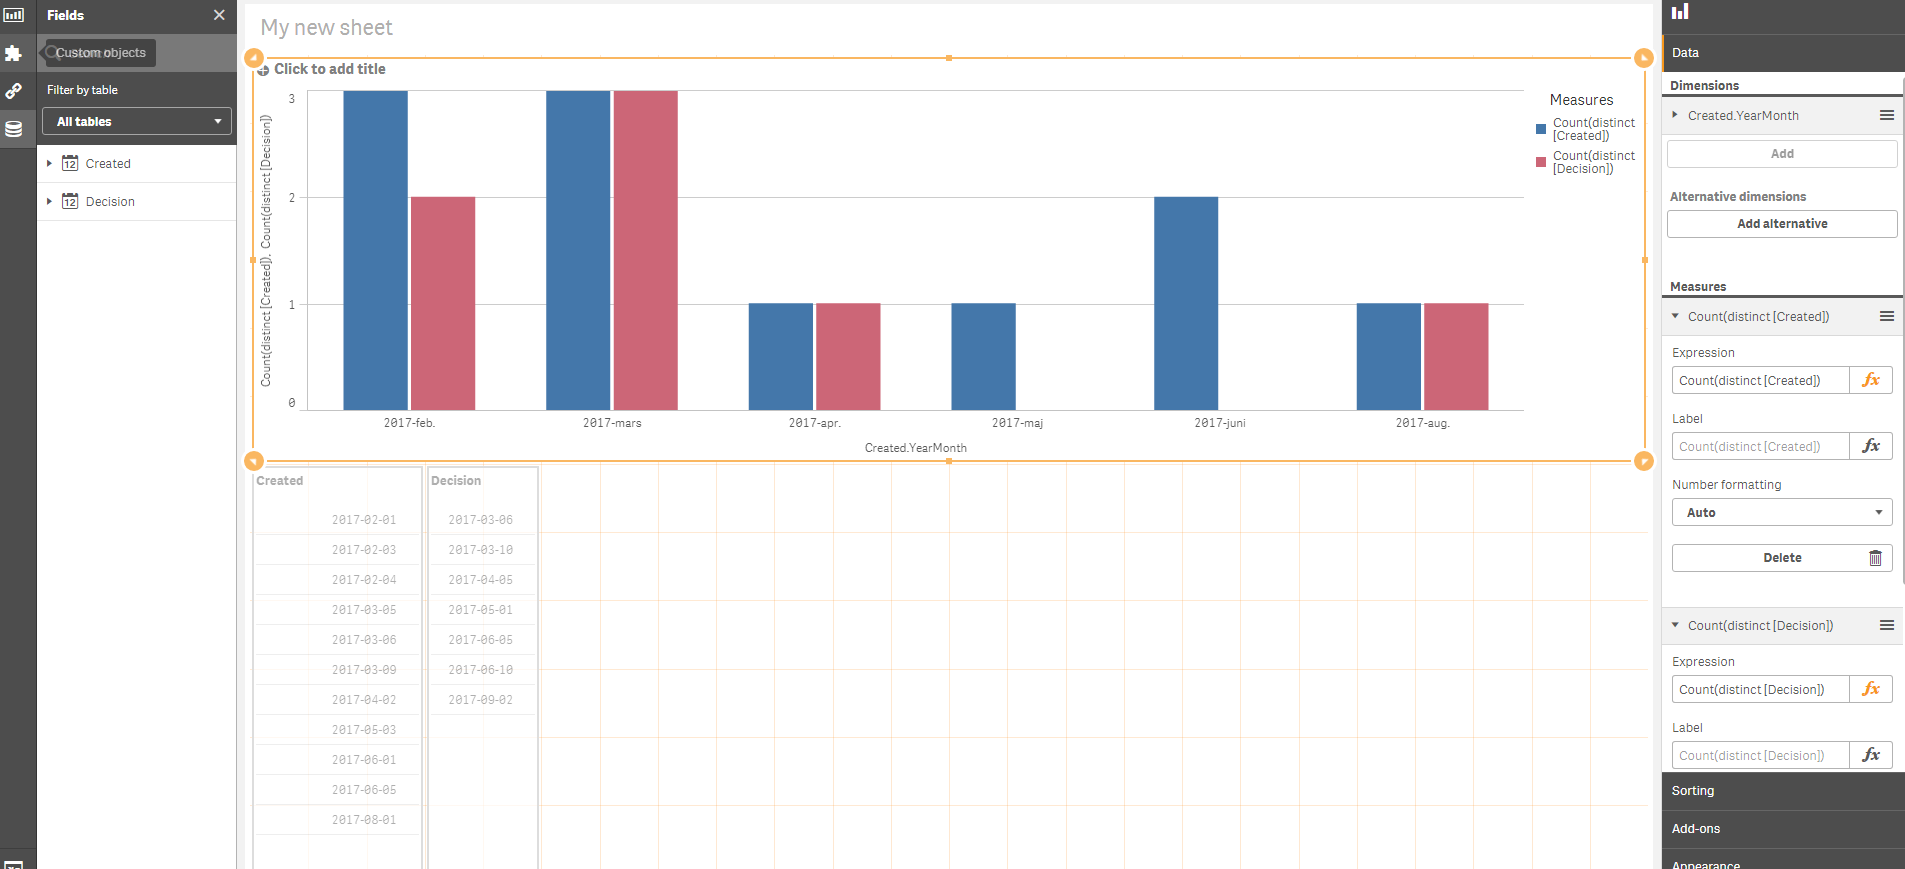
Thanks, but it doesn't present the right data. Please see below. One pic with Distinct Count and the other with only Count.
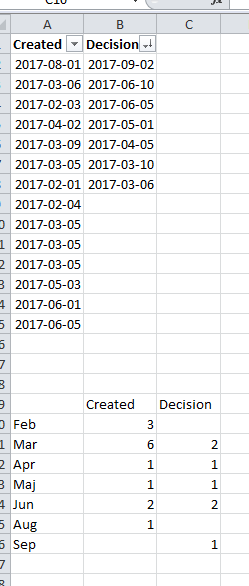
The third pic shows the real data.
I am thinking the problem is the dimension? It should be a neutral date/calendar? That's not connected to Createddate or decisiondate?
- Mark as New
- Bookmark
- Subscribe
- Mute
- Subscribe to RSS Feed
- Permalink
- Report Inappropriate Content
Hi! I would suggest that you get your database in different shape so you can use month as dimension:
LOAD
*
INLINE [
Date,Type
2017-01-05,Decision
2017-02-06,Decision
2017-01-02,Created
2017-01-04,Created
2017-02-04,Created
2017-02-05,Created
]
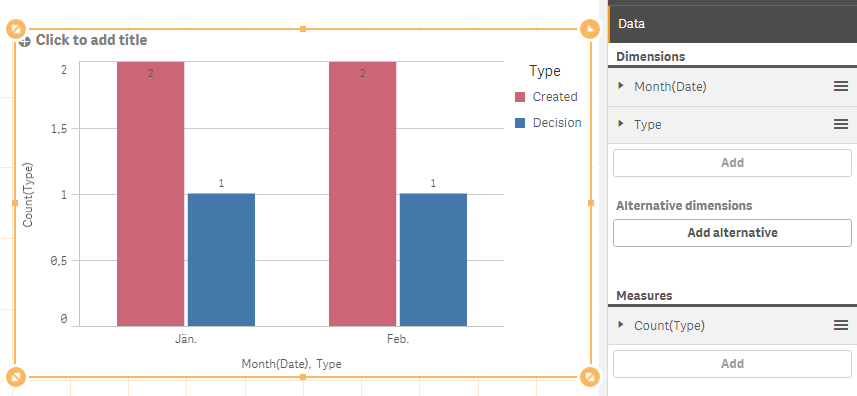
Then in the bar chart use:
Dimension: Month(Date)
Dimension: Type
Measure: Count(Type)
- Mark as New
- Bookmark
- Subscribe
- Mute
- Subscribe to RSS Feed
- Permalink
- Report Inappropriate Content
let's try using the below script:
fact_table_created:
load
[created date],
[created date] as CalendarDate
from your_table where len(trim([created date])) > 0;
fact_table_decision:
load
[decision date],
[decision date] as CalendarDate
from your_table where len(trim([decision date])) > 0;
finally in your bar chart you can use MonthName(CalendarDate) as dimension.
- Mark as New
- Bookmark
- Subscribe
- Mute
- Subscribe to RSS Feed
- Permalink
- Report Inappropriate Content
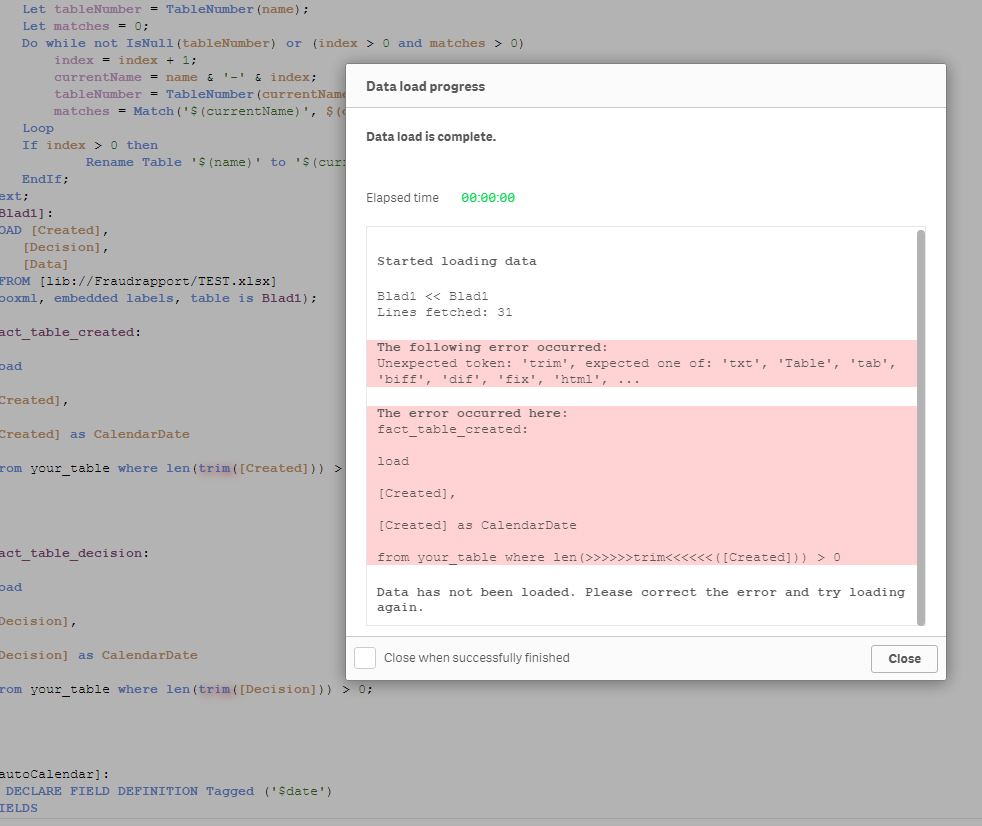
Hi
I get an error,
- Mark as New
- Bookmark
- Subscribe
- Mute
- Subscribe to RSS Feed
- Permalink
- Report Inappropriate Content
i think you should replace "your_table" with your real table name.
and i guess you have to replace "from" with "Resident" if you already loaded it.
- Mark as New
- Bookmark
- Subscribe
- Mute
- Subscribe to RSS Feed
- Permalink
- Report Inappropriate Content
Embarrassing, of course. I will check it out when I can give it my full attention. I will get back to you.
Thanks
- Mark as New
- Bookmark
- Subscribe
- Mute
- Subscribe to RSS Feed
- Permalink
- Report Inappropriate Content
Can you share de qvf with this data?
Thanks!