Unlock a world of possibilities! Login now and discover the exclusive benefits awaiting you.
- Qlik Community
- :
- Forums
- :
- Analytics
- :
- New to Qlik Analytics
- :
- Bar chart showing difference in sales between mont...
- Subscribe to RSS Feed
- Mark Topic as New
- Mark Topic as Read
- Float this Topic for Current User
- Bookmark
- Subscribe
- Mute
- Printer Friendly Page
- Mark as New
- Bookmark
- Subscribe
- Mute
- Subscribe to RSS Feed
- Permalink
- Report Inappropriate Content
Bar chart showing difference in sales between months
Hi,
How do I show the difference between sales value of previous and the next month in a bar chart? 
I need the difference in Apr and May, May and Jun, Jun and July and likewise for the remaining months in a bar graph.
Thanks and Regards,
Arjun
- Mark as New
- Bookmark
- Subscribe
- Mute
- Subscribe to RSS Feed
- Permalink
- Report Inappropriate Content
Hi,
I haven't seen that. Maybe with an extension?
The best thing I can think of is a stacked bar char with one bar being the Sum(Sales) and the other bar on top being fabs(Below(Sum(Sales)) - Sum(Sales))
Good luck,
Cheers,
Luis
- Mark as New
- Bookmark
- Subscribe
- Mute
- Subscribe to RSS Feed
- Permalink
- Report Inappropriate Content
Hi Arjun,
What exactly are you wanting to see? Do you want the bar chart with the change values shown?
or are you just wanting to see the change?
Have you looked at the waterfall chart?
Mark
- Mark as New
- Bookmark
- Subscribe
- Mute
- Subscribe to RSS Feed
- Permalink
- Report Inappropriate Content
Use This
- Mark as New
- Bookmark
- Subscribe
- Mute
- Subscribe to RSS Feed
- Permalink
- Report Inappropriate Content
Hi Mark,
The waterfall chart is having an option of just one measure. In this case I need months as Dimension, which I'm not able to use. I also tried out the extension and for some reason(maybe my ignorance!) it wont show negative bars when sales figure falls. See the image below,
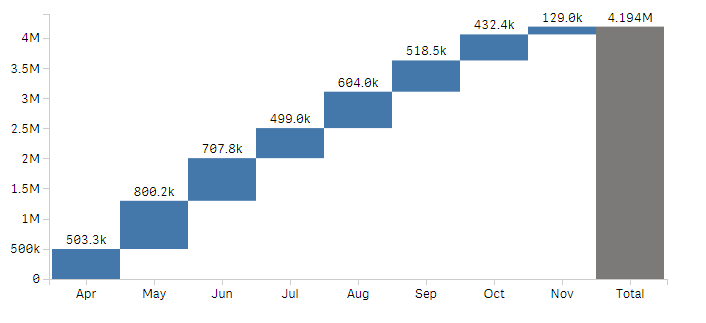
The sales value falls for the month of June(See the first image I posted before). Here shouldn't the bar fall negative?
This is the reason that I resorted to the original bar graph, for which I couldn't think a way through.
Regards,
Arjun
- Mark as New
- Bookmark
- Subscribe
- Mute
- Subscribe to RSS Feed
- Permalink
- Report Inappropriate Content
this is QlikView!
- Mark as New
- Bookmark
- Subscribe
- Mute
- Subscribe to RSS Feed
- Permalink
- Report Inappropriate Content
Hi,
Just wondering to know how did you go,
Cheers
Luis
When applicable please mark the appropriate replies as Correct. This will help community members know which discussions have already been addressed and have a possible known solution. Please mark replies as Helpful if the provided solution is helpful to the problem, but does not necessarily solve the indicated problem. You can mark multiple threads as Helpful if you feel additional info is useful to others