Unlock a world of possibilities! Login now and discover the exclusive benefits awaiting you.
- Qlik Community
- :
- Forums
- :
- Analytics
- :
- New to Qlik Analytics
- :
- Bar chart -sum of total sales minus sales of first...
- Subscribe to RSS Feed
- Mark Topic as New
- Mark Topic as Read
- Float this Topic for Current User
- Bookmark
- Subscribe
- Mute
- Printer Friendly Page
- Mark as New
- Bookmark
- Subscribe
- Mute
- Subscribe to RSS Feed
- Permalink
- Report Inappropriate Content
Bar chart -sum of total sales minus sales of first bar
Hi Experts,
I have a table like
Load * inline [
NAME,SAL
Raj,300
Vijay,400
Vidhya,250
Swaroop,100
];
Now I want result in a bar chart like,
1st bar should show Total SAL
2nd bar should show Total SAL - SAL
ex: on above data Total SAL is 300+400+250+100= 1050
so, 1st bar is 1050
2nd bar is 750 (1050 - 300)
Can anyone help me on this?
- Tags:
- chart bar
Accepted Solutions
- Mark as New
- Bookmark
- Subscribe
- Mute
- Subscribe to RSS Feed
- Permalink
- Report Inappropriate Content
Change to
If(GetSelectedCount(NAME) = 0,
If(RowNo() = 1,Sum(TOTAL SAL),Above(Column(1))-Above(Sum(SAL))))
Sum(SAL)
- Mark as New
- Bookmark
- Subscribe
- Mute
- Subscribe to RSS Feed
- Permalink
- Report Inappropriate Content
Hi,
Try like below,
Data:
Load * inline [
NAME,SAL
Raj,300
Vijay,400
Vidhya,250
Swaroop,100
];
Dimension:
load * Inline [
Dim
1
2
];
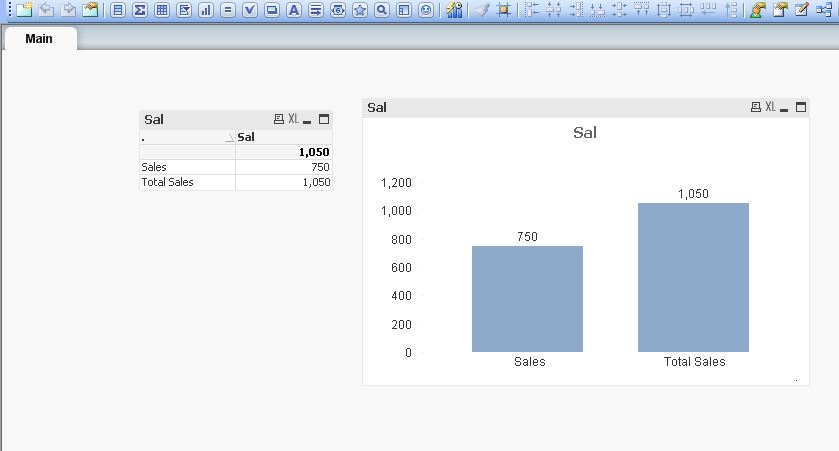
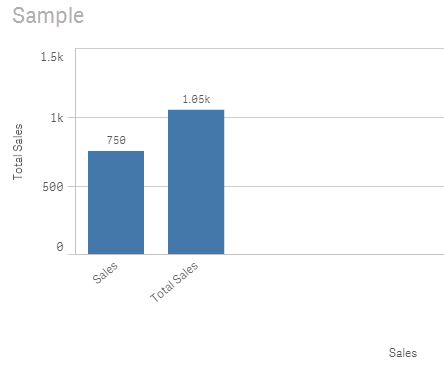
Create bar chart,
dimension is
=If(Dim = 1, 'Sales', 'Total Sales')
create measure like below,
=If(Dim = 1, sum({<NAME-={'Raj'}>}SAL), sum(total SAL))
- Mark as New
- Bookmark
- Subscribe
- Mute
- Subscribe to RSS Feed
- Permalink
- Report Inappropriate Content
Hi,
using qlik sense
- Mark as New
- Bookmark
- Subscribe
- Mute
- Subscribe to RSS Feed
- Permalink
- Report Inappropriate Content
Hi,
Dimension : NAME
Expression :
Sum(TOTAL SAL)
Sum(TOTAL SAL)-Sum(SAL)
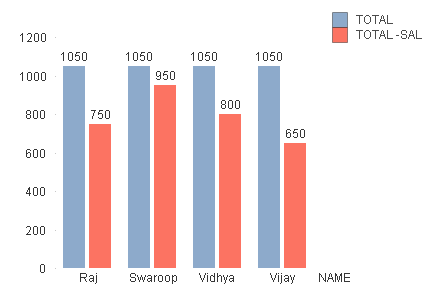
Regrds,
Antonio
- Mark as New
- Bookmark
- Subscribe
- Mute
- Subscribe to RSS Feed
- Permalink
- Report Inappropriate Content
Hi Antonio,
I need small change in the solution you provided.
if you observe in the chart, 1st bar for every name is having value like 1050.
but what i need is,
for the name Raj
1st bar-->1050
2nd bar--> 300
for the name Swaroop
1st bar--> 750 (1050-300) Here 300 is value of 2nd bar in previous dimension
2nd bar--> 100
for the name Vidhya
1st bar--> 650 (750-100)
2nd bar--> 250
for the name Vijay
1st bar-->400
2nd bar-->400
- Mark as New
- Bookmark
- Subscribe
- Mute
- Subscribe to RSS Feed
- Permalink
- Report Inappropriate Content
Load * inline [
NAME,SAL
Raj,300
Swaroop,100
Vidhya,250
Vijay,400
];
If(RowNo() = 1,Sum(TOTAL SAL),Above(Column(1))-Above(Sum(SAL)))
Sum(SAL)

- Mark as New
- Bookmark
- Subscribe
- Mute
- Subscribe to RSS Feed
- Permalink
- Report Inappropriate Content
Hi Antonio,
Awesome...!! that worked fine. 
I need to implement one hide/show mechanism on the first bar.
Like, by default it should show both bars.
but, when a selection is made, then the blue bar should not display.
in above chart, lets assume that name Vidhya is selected, then in that case I should see only Vidhya SAL which is 250.

- Mark as New
- Bookmark
- Subscribe
- Mute
- Subscribe to RSS Feed
- Permalink
- Report Inappropriate Content
Change to
If(GetSelectedCount(NAME) = 0,
If(RowNo() = 1,Sum(TOTAL SAL),Above(Column(1))-Above(Sum(SAL))))
Sum(SAL)
- Mark as New
- Bookmark
- Subscribe
- Mute
- Subscribe to RSS Feed
- Permalink
- Report Inappropriate Content
Thanks Antonio.
Its wroking FIne.