Unlock a world of possibilities! Login now and discover the exclusive benefits awaiting you.
- Qlik Community
- :
- Forums
- :
- Analytics
- :
- New to Qlik Analytics
- :
- Re: Box Plot Graph issue in selections of Dimensio...
Options
- Subscribe to RSS Feed
- Mark Topic as New
- Mark Topic as Read
- Float this Topic for Current User
- Bookmark
- Subscribe
- Mute
- Printer Friendly Page
Turn on suggestions
Auto-suggest helps you quickly narrow down your search results by suggesting possible matches as you type.
Showing results for
Contributor III
2019-05-28
01:15 AM
- Mark as New
- Bookmark
- Subscribe
- Mute
- Subscribe to RSS Feed
- Permalink
- Report Inappropriate Content
Box Plot Graph issue in selections of Dimension
Dear All,
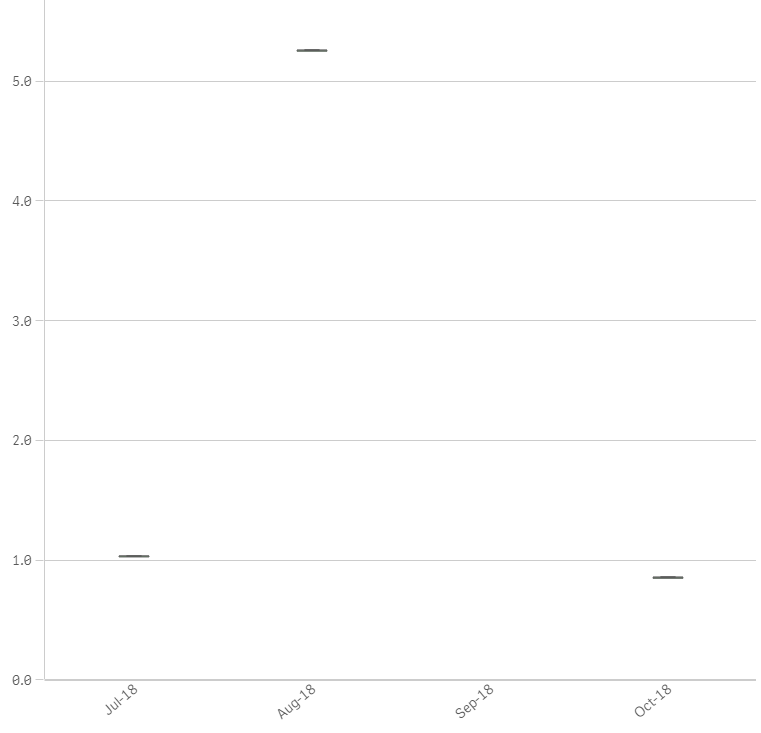
I'm using the qlik sense Box Plot One Standard Deviations.
Dimension 1 : Location
Dimension 2 : Year Month
Measure : Avg
if single location is selected then box plot chart is showing only avg not showing the Min&Max Deviations in the Chart please find below image.
1,142 Views
4 Replies
Employee
2019-05-28
01:42 AM
- Mark as New
- Bookmark
- Subscribe
- Mute
- Subscribe to RSS Feed
- Permalink
- Report Inappropriate Content
If you want Location selection to be ignored you can use Set analysis to ignore Location selections in your measure:
Avg({<Location=>}measure)
Avg({<Location=>}measure)
1,134 Views
Contributor III
2019-05-29
02:16 AM
Author
- Mark as New
- Bookmark
- Subscribe
- Mute
- Subscribe to RSS Feed
- Permalink
- Report Inappropriate Content
Hi @Lisa_P
Thank you for reply.
i do not want to ignore the Selections of location.
if i select one location it should show max/min deviations please find the attached image.
1,115 Views
Employee
2019-05-29
02:23 AM
- Mark as New
- Bookmark
- Subscribe
- Mute
- Subscribe to RSS Feed
- Permalink
- Report Inappropriate Content
please attach image
1,109 Views
Contributor III
2019-05-29
03:42 AM
Author
- Mark as New
- Bookmark
- Subscribe
- Mute
- Subscribe to RSS Feed
- Permalink
- Report Inappropriate Content
1,104 Views
Community Browser