Unlock a world of possibilities! Login now and discover the exclusive benefits awaiting you.
- Qlik Community
- :
- Forums
- :
- Analytics
- :
- New to Qlik Analytics
- :
- Re: COUNT TOTAL (DISTINCT)
- Subscribe to RSS Feed
- Mark Topic as New
- Mark Topic as Read
- Float this Topic for Current User
- Bookmark
- Subscribe
- Mute
- Printer Friendly Page
- Mark as New
- Bookmark
- Subscribe
- Mute
- Subscribe to RSS Feed
- Permalink
- Report Inappropriate Content
COUNT TOTAL (DISTINCT)
Hi All,
I am looking to get the percentage the total values within a year. I thought the formula below should work but it doesn't.
Count(DISTINCT{<MONTH_ID = {201701}>} POLICY_ID) / Count(DISTINCT TOTAL {<MONTH_ID = {201701}>} POLICY_ID)
Anyone have any ideas?
Regards
Finbar
- « Previous Replies
-
- 1
- 2
- Next Replies »
Accepted Solutions
- Mark as New
- Bookmark
- Subscribe
- Mute
- Subscribe to RSS Feed
- Permalink
- Report Inappropriate Content
May be like this
Count(DISTINCT{<MONTH_ID = {201701}>} POLICY_ID) / Count(DISTINCT {1<MONTH_ID = {201701}>} POLICY_ID)
- Mark as New
- Bookmark
- Subscribe
- Mute
- Subscribe to RSS Feed
- Permalink
- Report Inappropriate Content
Within a year? but you still have the same set analysis for the denominator restricting your denominator to 201701
- Mark as New
- Bookmark
- Subscribe
- Mute
- Subscribe to RSS Feed
- Permalink
- Report Inappropriate Content
Hi Sunny,
Sorry should have been more clearer. I also have a filter selected within the filter pane.
I want the KPI widget to select all policy_id's in 201701 where the filter is applied DIVIDED BY all policy_id's in 201701 where there it is not taking into consideration the filter.
Regards
Finbar
- Mark as New
- Bookmark
- Subscribe
- Mute
- Subscribe to RSS Feed
- Permalink
- Report Inappropriate Content
May be
Count(DISTINCT{<MONTH_ID = {201701}>} POLICY_ID) / Count(DISTINCT TOTAL {<MONTH_ID = {'2017*'}>} POLICY_ID)
- Mark as New
- Bookmark
- Subscribe
- Mute
- Subscribe to RSS Feed
- Permalink
- Report Inappropriate Content
I am not sure I understand... are you looking to get the row level sum to add up to 100%? What is your chart dimension where you performing this calculation? Try like this
Count(DISTINCT{<MONTH_ID = {201701}>} POLICY_ID) /
Sum(TOTAL Aggr(Count(DISTINCT {<MONTH_ID = {201701}>} POLICY_ID), Dimension/s))
- Mark as New
- Bookmark
- Subscribe
- Mute
- Subscribe to RSS Feed
- Permalink
- Report Inappropriate Content
Hi sasiparupudi1
That doesn't work unfortunately.
- Mark as New
- Bookmark
- Subscribe
- Mute
- Subscribe to RSS Feed
- Permalink
- Report Inappropriate Content
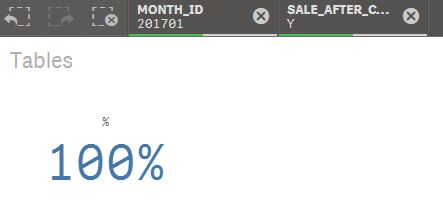
Hi stalwar1, that doesnt work unfortunately it brings it up to 100%. I am looking for the number of policies that have had a sale 201701 as a % of the total policies on 201701
- Mark as New
- Bookmark
- Subscribe
- Mute
- Subscribe to RSS Feed
- Permalink
- Report Inappropriate Content
How do you determine sale? I mean I understand total policies... but how does it different from policies which have sale and how do we know what has sale?
- Mark as New
- Bookmark
- Subscribe
- Mute
- Subscribe to RSS Feed
- Permalink
- Report Inappropriate Content
May be like this
Count(DISTINCT{<MONTH_ID = {201701}>} POLICY_ID) / Count(DISTINCT {1<MONTH_ID = {201701}>} POLICY_ID)
- Mark as New
- Bookmark
- Subscribe
- Mute
- Subscribe to RSS Feed
- Permalink
- Report Inappropriate Content
I have a column in my table where I have flagged a policy with a sale as 'Y'
- « Previous Replies
-
- 1
- 2
- Next Replies »