Unlock a world of possibilities! Login now and discover the exclusive benefits awaiting you.
- Qlik Community
- :
- Forums
- :
- Analytics
- :
- New to Qlik Analytics
- :
- Calculating Percentage change in a pivot table as ...
- Subscribe to RSS Feed
- Mark Topic as New
- Mark Topic as Read
- Float this Topic for Current User
- Bookmark
- Subscribe
- Mute
- Printer Friendly Page
- Mark as New
- Bookmark
- Subscribe
- Mute
- Subscribe to RSS Feed
- Permalink
- Report Inappropriate Content
Calculating Percentage change in a pivot table as a field
Hi Guys, I want to be able to show % change in sales from 2017 to 2018 in a pivot table that looks like this-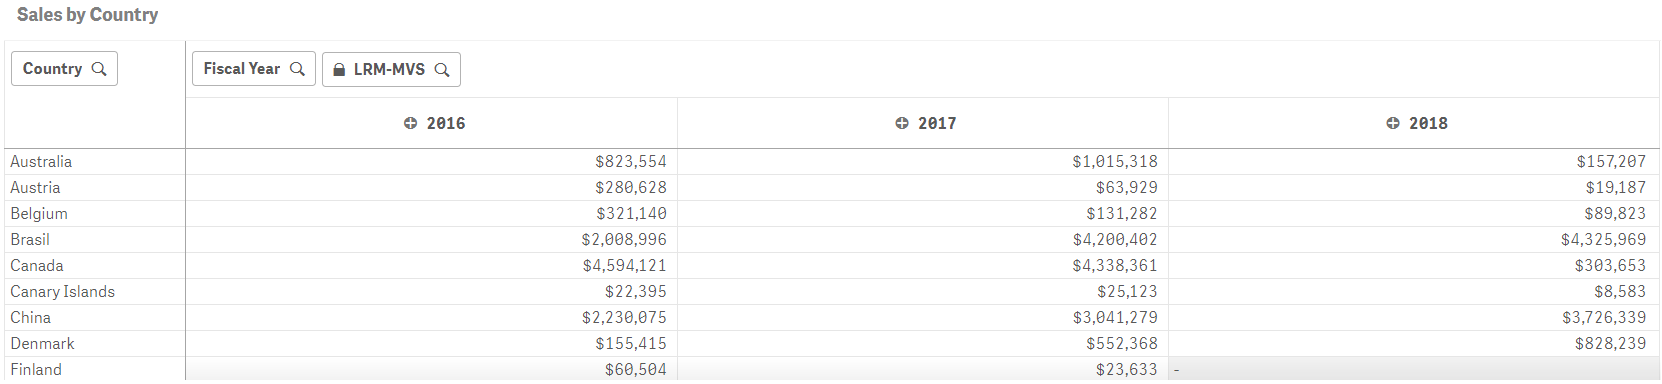
So there will be a new column " growth from '17 to '18 " that will reflect the percentage change from 2017 to 2018 for australia, austria , belgium and so on. The first entry will thus be -84% for change in sales in Australia --> (2018-2017)/2017
Can anyone tell me how the code for this should be?
Accepted Solutions
- Mark as New
- Bookmark
- Subscribe
- Mute
- Subscribe to RSS Feed
- Permalink
- Report Inappropriate Content
- Mark as New
- Bookmark
- Subscribe
- Mute
- Subscribe to RSS Feed
- Permalink
- Report Inappropriate Content
May be this
Sum(Sales)/Before(Sum({<[Fiscal Year]>}Sales)) - 1
- Mark as New
- Bookmark
- Subscribe
- Mute
- Subscribe to RSS Feed
- Permalink
- Report Inappropriate Content
This worked instantly! Thanks a ton!
- Mark as New
- Bookmark
- Subscribe
- Mute
- Subscribe to RSS Feed
- Permalink
- Report Inappropriate Content
Awesome, please close the thread if you got what you wanted.
Best,
Sunny
- Mark as New
- Bookmark
- Subscribe
- Mute
- Subscribe to RSS Feed
- Permalink
- Report Inappropriate Content
Don't worry about this time, but this is not how you need to close a thread by marking 'Assumed Answer' when you actually have an answer which worked for you  .
.
Please look here to see how you should be closing a thread
- Mark as New
- Bookmark
- Subscribe
- Mute
- Subscribe to RSS Feed
- Permalink
- Report Inappropriate Content
I am using flags and other dimensions. how do i write it.
sum({$<%df_IsThisDate={1}, %Process={"Sales"},[SKU Group] = {'Blocks'}>} [# Net Amount])/Before (sum({$<%df_IsThisDate={1},FiscalYear, %Process={"Sales"},[SKU Group] = {'Blocks'}>} [# Net Amount])) - 1
Thanks