Unlock a world of possibilities! Login now and discover the exclusive benefits awaiting you.
- Qlik Community
- :
- Forums
- :
- Analytics
- :
- New to Qlik Analytics
- :
- Re: Can You Plug In New Data in a Table for Scenar...
- Subscribe to RSS Feed
- Mark Topic as New
- Mark Topic as Read
- Float this Topic for Current User
- Bookmark
- Subscribe
- Mute
- Printer Friendly Page
- Mark as New
- Bookmark
- Subscribe
- Mute
- Subscribe to RSS Feed
- Permalink
- Report Inappropriate Content
Can You Plug In New Data in a Table for Scenario Analysis?
New to Qlik, thanks for your patience. Posting this after others were very helpful with another issue.
1. Is it possible to plug in new data on the fly in a table for scenario analysis, like one would do in excel?
For example, I have a table where the first five columns are simple count expressions on a field and the remaining columns are derived with expressions that calculate this data (summing them, percentages, ratios etc).

Ideally, it would be helpful to be able to plug new numbers into one of the first five columns to see how the figures would change in certain situations. The data in the derived columns can also be useful across multiple fields, but the table chart doesn't look like it supports alternative dimensions.
2. If this analysis is possible, can you swap fields?
It seems like there was a discussion similar to this, but no clear answer.
"What if" Analysis in Qlik Sense
I'm on server version of qlik, and I have some hoops to jump through for extensions, so it would be ideal without. But, if that's the only way, I can try to push through.
Thanks in advance!
Accepted Solutions
- Mark as New
- Bookmark
- Subscribe
- Mute
- Subscribe to RSS Feed
- Permalink
- Report Inappropriate Content
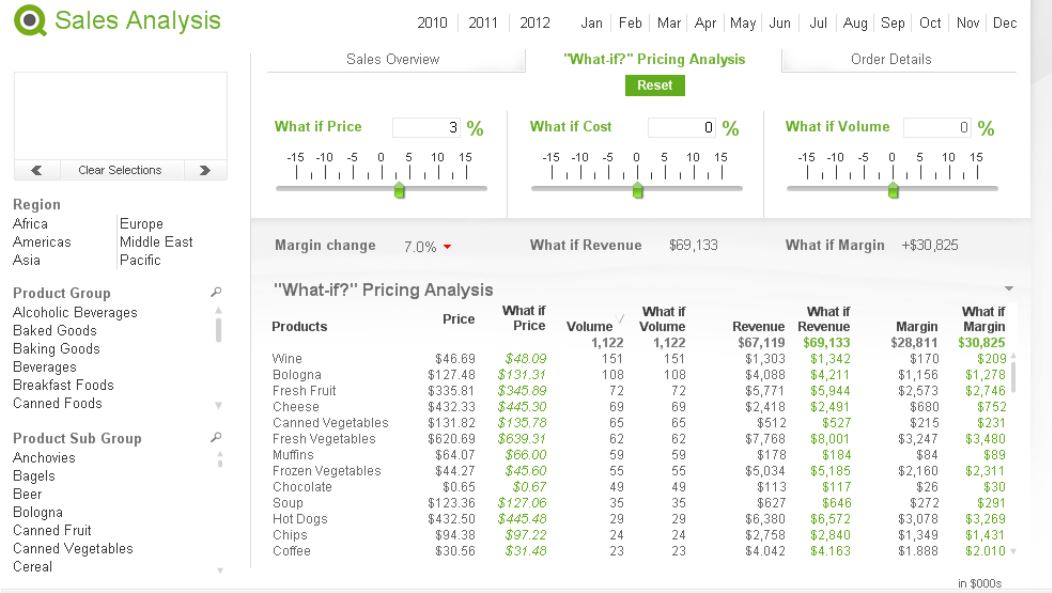
To plug in your own values you could use variables and an extension like qsvariable to adjust it via an input box or a slider like above in your example.
Alternative dimensions have been supported in Qlik sense out the box for awhile now so check your version.
- Mark as New
- Bookmark
- Subscribe
- Mute
- Subscribe to RSS Feed
- Permalink
- Report Inappropriate Content
Thank you again, Andy!
I'll try this out and come back to mark this closed / correct if I can get it to work.