Unlock a world of possibilities! Login now and discover the exclusive benefits awaiting you.
- Qlik Community
- :
- Forums
- :
- Analytics
- :
- New to Qlik Analytics
- :
- Re: Can't get KPI to show table column Total resul...
- Subscribe to RSS Feed
- Mark Topic as New
- Mark Topic as Read
- Float this Topic for Current User
- Bookmark
- Subscribe
- Mute
- Printer Friendly Page
- Mark as New
- Bookmark
- Subscribe
- Mute
- Subscribe to RSS Feed
- Permalink
- Report Inappropriate Content
Can't get KPI to show table column Total result
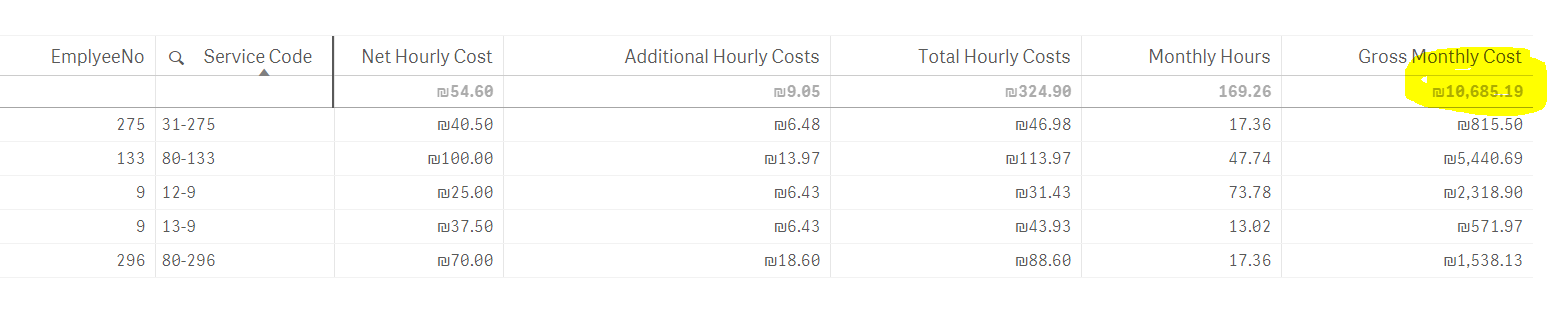
I am trying to show the Table sum in yellow below (column Gross Monthly Cost) in a KPI but i can't get it work.
This "gross Monthly Cost" column calculates Total Hourly Costs * Monthly Hours.
Here are the expressions in each column below:
Net Hourly Cost - Sum(EmployeeRate)
Additional Hourly Costs - $(vAluyotNilvotLeshaa)
Monthly Hours - Sum([SessionMonthlyDuration(numeric)])
Gross Monthly Cost - ($(vAluyotNilvotLeshaa)+EmployeeRate)*Sum([SessionMonthlyDuration(numeric)])
If I enter the last expression SUM($(vAluyotNilvotLeshaa)+EmployeeRate)*Sum([SessionMonthlyDuration(numeric)]) in a KPI I get "-".
How do I get the KPI to show the summary figure in yellow?
Accepted Solutions
- Mark as New
- Bookmark
- Subscribe
- Mute
- Subscribe to RSS Feed
- Permalink
- Report Inappropriate Content
Ah sorry, you are trying to get the result in a KPI object.
Seems like your calculation needs some advanced aggregation:
Sum(
Aggr(
($(vAluyotNilvotLeshaa)+EmployeeRate)*Sum([SessionMonthlyDuration(numeric)])
, EmployeeNo, [Service Code] )
)
- Mark as New
- Bookmark
- Subscribe
- Mute
- Subscribe to RSS Feed
- Permalink
- Report Inappropriate Content
Try
=(Column(1)+Column(2)) * Column(4)
to reference the other column results in your new expression
If this doesn't work, then please post the definition of variable vAluyotNilvotLeshaa and if possible, a small sample QVF.
- Mark as New
- Bookmark
- Subscribe
- Mute
- Subscribe to RSS Feed
- Permalink
- Report Inappropriate Content
Ah sorry, you are trying to get the result in a KPI object.
Seems like your calculation needs some advanced aggregation:
Sum(
Aggr(
($(vAluyotNilvotLeshaa)+EmployeeRate)*Sum([SessionMonthlyDuration(numeric)])
, EmployeeNo, [Service Code] )
)
- Mark as New
- Bookmark
- Subscribe
- Mute
- Subscribe to RSS Feed
- Permalink
- Report Inappropriate Content
Thanks Stefan! you are my hero!! 
I tried playing around with AGGR but didn't get it to work. Your expression did the trick. Thank you!