Unlock a world of possibilities! Login now and discover the exclusive benefits awaiting you.
- Qlik Community
- :
- Forums
- :
- Analytics
- :
- New to Qlik Analytics
- :
- Re: Change color of 3 line graphs in qliksense
- Subscribe to RSS Feed
- Mark Topic as New
- Mark Topic as Read
- Float this Topic for Current User
- Bookmark
- Subscribe
- Mute
- Printer Friendly Page
- Mark as New
- Bookmark
- Subscribe
- Mute
- Subscribe to RSS Feed
- Permalink
- Report Inappropriate Content
Change color of 3 line graphs in qliksense
Hi,
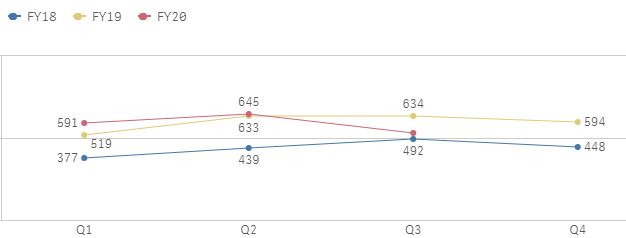
I have three line graphs in my chart. I want to change the color of the lines eg: FY20 - Green, FY19 -Blue and FY18 - Red.
Attached is the current line graph pic
- Tags:
- chart
- line chart
- Subscribe by Topic:
-
General Question
-
line graph
-
new user
-
new_to_qliksense
-
Qlik Sense
-
qliksense chart
Accepted Solutions
- Mark as New
- Bookmark
- Subscribe
- Mute
- Subscribe to RSS Feed
- Permalink
- Report Inappropriate Content
Sorry, my original response was assuming it was QlikView, because that is the forum the question was posted in.
For Qlik Sense - Create a Master Dimension for Fiscal Year and create the custom colors in that.
- Mark as New
- Bookmark
- Subscribe
- Mute
- Subscribe to RSS Feed
- Permalink
- Report Inappropriate Content
Just go into the properties of the chart, on the Color tab, change the color tiles to be red, blue and green
- Mark as New
- Bookmark
- Subscribe
- Mute
- Subscribe to RSS Feed
- Permalink
- Report Inappropriate Content
Hi Lisa,
There is no option into the properties for the color tiles. This is what I see:

If I change the color tab to custom The legend field gets hidden.
If I change the color to Auto this is what I see:

- Mark as New
- Bookmark
- Subscribe
- Mute
- Subscribe to RSS Feed
- Permalink
- Report Inappropriate Content
Sorry, my original response was assuming it was QlikView, because that is the forum the question was posted in.
For Qlik Sense - Create a Master Dimension for Fiscal Year and create the custom colors in that.
- Mark as New
- Bookmark
- Subscribe
- Mute
- Subscribe to RSS Feed
- Permalink
- Report Inappropriate Content
create 3 master measures and choose color
master measure allow to choose color