Unlock a world of possibilities! Login now and discover the exclusive benefits awaiting you.
- Qlik Community
- :
- Forums
- :
- Analytics
- :
- New to Qlik Analytics
- :
- Change color of text & number in a pie chart
- Subscribe to RSS Feed
- Mark Topic as New
- Mark Topic as Read
- Float this Topic for Current User
- Bookmark
- Subscribe
- Mute
- Printer Friendly Page
- Mark as New
- Bookmark
- Subscribe
- Mute
- Subscribe to RSS Feed
- Permalink
- Report Inappropriate Content
Change color of text & number in a pie chart
Hi All,
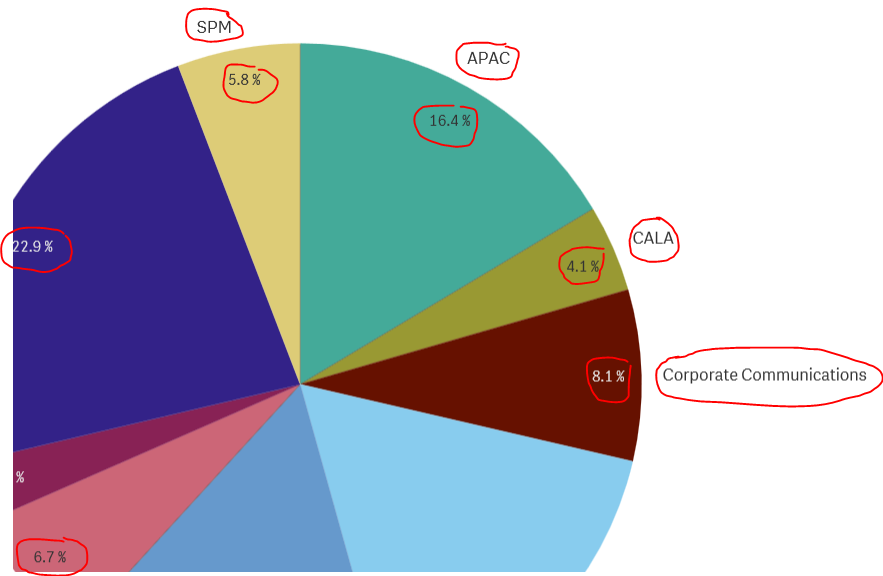
I need to change the color of number and text in a pie chart to black. It is currently grey in color. How can I achieve this?
- Mark as New
- Bookmark
- Subscribe
- Mute
- Subscribe to RSS Feed
- Permalink
- Report Inappropriate Content
Hello Ajinkya
I don't think this is possible with the default Qlik Sense pie chart, maybe try a pie-chart extension from http://branch.qlik.com/#!/project
I tried it with the Vizlib Pie Chart (as I have it already installed) and it allows you to color the inside data-points but not the outside dimension values.
Mathias
- Mark as New
- Bookmark
- Subscribe
- Mute
- Subscribe to RSS Feed
- Permalink
- Report Inappropriate Content
but I guess Vizlib extensions are not freeware. Free upto 5 users only
- Mark as New
- Bookmark
- Subscribe
- Mute
- Subscribe to RSS Feed
- Permalink
- Report Inappropriate Content
Yes Is did look into Vizlib extensions. It is free upto 5 users and also the data can only be exported in excel.
Well this wont fit in our use case. We will stick to the default Qliksense properties. Thank you all!