Unlock a world of possibilities! Login now and discover the exclusive benefits awaiting you.
- Qlik Community
- :
- Forums
- :
- Analytics
- :
- New to Qlik Analytics
- :
- Re: Change over Previous Month
- Subscribe to RSS Feed
- Mark Topic as New
- Mark Topic as Read
- Float this Topic for Current User
- Bookmark
- Subscribe
- Mute
- Printer Friendly Page
- Mark as New
- Bookmark
- Subscribe
- Mute
- Subscribe to RSS Feed
- Permalink
- Report Inappropriate Content
Change over Previous Month
Hi,
I am trying to plot a monthly variance chart i.e current month variance over previous month.
Followed the approach described here
http://aftersync.com/blog/the-magic-of-set-analysis-point-in-time-reporting
So the prior month count would be:
Count({$<MonthID = {$(=Max(MonthID)-1)}, Year =,Month = >} distinct id)
So a tabular representation should look similar to the table below
Month | Count | Previous Month Count | Variance
Jan 2016 10 0 0
Feb 2016 15 10 50%
March 2016 10 15 -33%
But I am getting zeros in all for all previous count except for the second last month Feb 2016 in this case . I am guessing it because of Max(MonthID) -1 evaluates to Feb 2016.
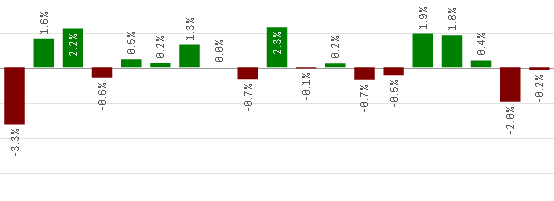
Is there a way get the prior month count for all months? So that I can plot a graph similar to the one below; It could be a count difference

Accepted Solutions
- Mark as New
- Bookmark
- Subscribe
- Mute
- Subscribe to RSS Feed
- Permalink
- Report Inappropriate Content
You could try to use Before function.
if your "Current" expression is Count(Distinct ID)
your "Before Month" expression would be Before(Count(Distinct ID))
and "Variance" would be Count(Distinct ID)/Before(Count(Distinct ID))-1
This will work if you have only Month (or Month/Year) Dimmention. If it doesn't work, try with Above, instead of Before.
- Mark as New
- Bookmark
- Subscribe
- Mute
- Subscribe to RSS Feed
- Permalink
- Report Inappropriate Content
Look at the approach specified here: The As-Of Table
Like you have pointed out that Month - 1 gives you Feb, it won't be able to give any other month's information since set analysis is evaluated once per table and not on each row. In order to overcome the problem, you need to create a LinkTable where you can link Previous Month's data to current Month.
Try the approach provided in the link above, but if you still have trouble, provide some sample data to help you better.
Best,
Sunny
- Mark as New
- Bookmark
- Subscribe
- Mute
- Subscribe to RSS Feed
- Permalink
- Report Inappropriate Content
You could try to use Before function.
if your "Current" expression is Count(Distinct ID)
your "Before Month" expression would be Before(Count(Distinct ID))
and "Variance" would be Count(Distinct ID)/Before(Count(Distinct ID))-1
This will work if you have only Month (or Month/Year) Dimmention. If it doesn't work, try with Above, instead of Before.
- Mark as New
- Bookmark
- Subscribe
- Mute
- Subscribe to RSS Feed
- Permalink
- Report Inappropriate Content
hi,
Try this,
DIM: Month
Exp: Count(Distinct ID)
EXp: (Count(Distinct ID)- above(Count(DisitnctID)) / above(Count(Distinct ID))
- Mark as New
- Bookmark
- Subscribe
- Mute
- Subscribe to RSS Feed
- Permalink
- Report Inappropriate Content
Thanks guys Above(Count(Distinct ID) -1) worked. I will Try the The As-Of Table approach as well.