Unlock a world of possibilities! Login now and discover the exclusive benefits awaiting you.
- Qlik Community
- :
- Forums
- :
- Analytics
- :
- New to Qlik Analytics
- :
- Re: Changing color of bar chart
- Subscribe to RSS Feed
- Mark Topic as New
- Mark Topic as Read
- Float this Topic for Current User
- Bookmark
- Subscribe
- Mute
- Printer Friendly Page
- Mark as New
- Bookmark
- Subscribe
- Mute
- Subscribe to RSS Feed
- Permalink
- Report Inappropriate Content
Changing color of bar chart
Hello Everyone,
I am stuck in an issue. I am creating a bar chart but want to show my measures as per my choice of color.I cann't find out how to change the color. In my case, expressions are:
1: PY Revenue
2: CY Revenue
3: Forecasted Sales
I want to change the colors of above measures. Pls find attached file for the same.
Can anyone help me out?
Accepted Solutions
- Mark as New
- Bookmark
- Subscribe
- Mute
- Subscribe to RSS Feed
- Permalink
- Report Inappropriate Content
You can create the measure as a master item and define the color.Then use this master item as the measure in bar chart
- Mark as New
- Bookmark
- Subscribe
- Mute
- Subscribe to RSS Feed
- Permalink
- Report Inappropriate Content
- Mark as New
- Bookmark
- Subscribe
- Mute
- Subscribe to RSS Feed
- Permalink
- Report Inappropriate Content
how would you change the color based on ?
- Mark as New
- Bookmark
- Subscribe
- Mute
- Subscribe to RSS Feed
- Permalink
- Report Inappropriate Content
Hello,
which Version of Qlik Sense did you use?
If you use one of the newer versions you can create a new Master Item for each Measure and select a color for it:

After that you can use the Master Item in your Visualisation

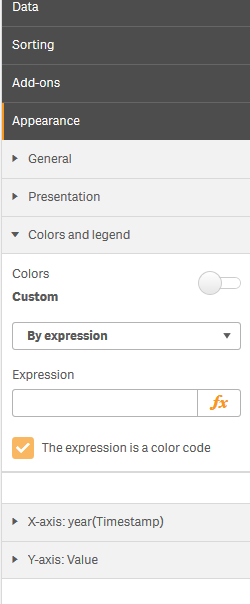
Also you can color your visualisation by Expression like
if(bla < bla, rgb(255,255,255),rgb(255,0,0))
- Mark as New
- Bookmark
- Subscribe
- Mute
- Subscribe to RSS Feed
- Permalink
- Report Inappropriate Content
You can create the measure as a master item and define the color.Then use this master item as the measure in bar chart