Unlock a world of possibilities! Login now and discover the exclusive benefits awaiting you.
- Qlik Community
- :
- Forums
- :
- Analytics
- :
- New to Qlik Analytics
- :
- Re: Color Bars if Greater than average.
- Subscribe to RSS Feed
- Mark Topic as New
- Mark Topic as Read
- Float this Topic for Current User
- Bookmark
- Subscribe
- Mute
- Printer Friendly Page
- Mark as New
- Bookmark
- Subscribe
- Mute
- Subscribe to RSS Feed
- Permalink
- Report Inappropriate Content
Color Bars if Greater than average.
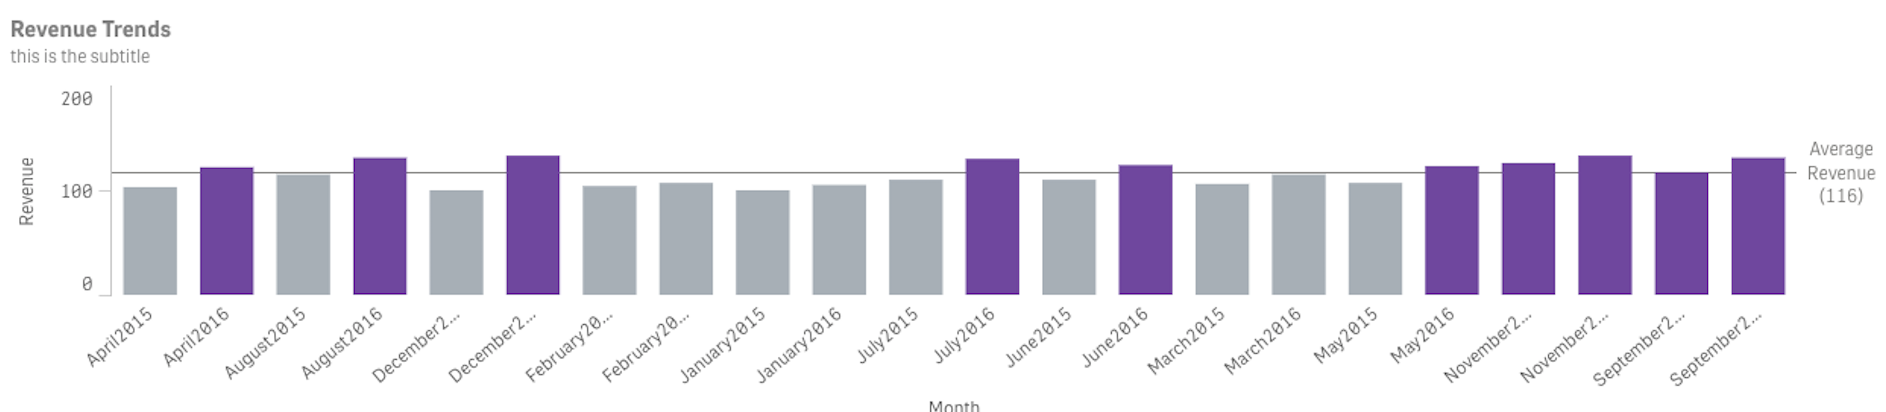
Hi all, I have a graph that has an average revenue per month. I want the bars to change color (from grey to purple) if the bar is greater than the average. That average will change each month, so I would like it to be able to automatically update.
I tried if(sum(Revenue)>avg(Revenue),rgb(115,71,156),rgb(165,175,182)) but that doesn't seem to work. I can only get it to work if I hardcode the average number in there. like this: if(sum(Revenue)>116,rgb(115,71,156),rgb(165,175,182))
Any ideas? Thanks!
Melissa
Accepted Solutions
- Mark as New
- Bookmark
- Subscribe
- Mute
- Subscribe to RSS Feed
- Permalink
- Report Inappropriate Content
try this
if(sum(Revenue)>avg(TOTAL Revenue),rgb(115,71,156),rgb(165,175,182)),
Looks like you want to compare Sum to overall average, TOTAL will ignore dimension and will give you overall average.
- Mark as New
- Bookmark
- Subscribe
- Mute
- Subscribe to RSS Feed
- Permalink
- Report Inappropriate Content
Hello Melissa,
Trust that you are doing well!
The expression you have used looks correct to me. I request you to validate the sum(Revenue) & avg(Revenue) values against the dimension you used in the chart (to achieve the same you can add another expression avg(Revenue) on the bar chart). I strongly believe that the sum(Revenue) is always greater/lower than the avg(Revenue). Due to this you are not able to see the color difference in bar.
You can share the application with sample data, if problem still persists.
Hope this will help!
Regards!
Rahul
- Mark as New
- Bookmark
- Subscribe
- Mute
- Subscribe to RSS Feed
- Permalink
- Report Inappropriate Content
I'm not sure if this will work but if you can store your avg(Revenue) as a variable and use it to color code it?
Ex:
if(sum(Revenue)>$(vAvgRev),rgb(115,71,156),rgb(165,175,182))
or you can store both expressions into variable
if($(vSumAvg)>$(vAvgRev),rgb(115,71,156),rgb(165,175,182))
if doesn't work maybe can you share your sample data or app? I cannot find a scenario to replicate your issue.
- Mark as New
- Bookmark
- Subscribe
- Mute
- Subscribe to RSS Feed
- Permalink
- Report Inappropriate Content
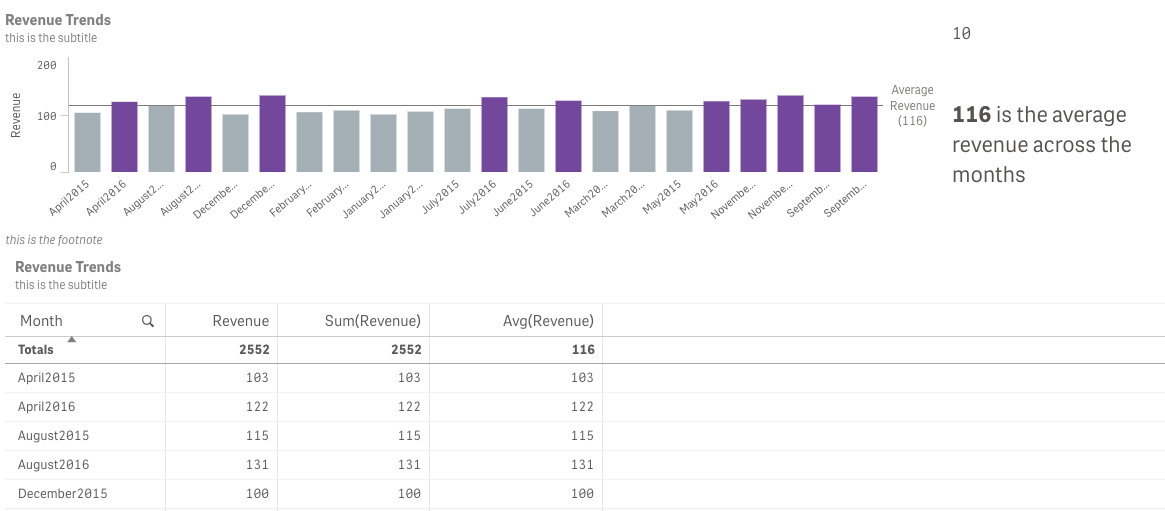
I turned the bar graph into a bar chart and the average revenue seems to calculate for each line and I want to compare it to the OVERALL average revenue ($116) and I cannot figure out how to keep it from taking the average for the single month, which since there is only one value for revenue per month, would always equal the sum.
- Mark as New
- Bookmark
- Subscribe
- Mute
- Subscribe to RSS Feed
- Permalink
- Report Inappropriate Content
Hi, I am using QS Server, and do not know how to get the application file from there fore you. Attached is the data I was using. It was a very small set of data. I was trying to test on this before putting this into a real life situation. Thank you for your help.
- Mark as New
- Bookmark
- Subscribe
- Mute
- Subscribe to RSS Feed
- Permalink
- Report Inappropriate Content
try this
if(sum(Revenue)>avg(TOTAL Revenue),rgb(115,71,156),rgb(165,175,182)),
Looks like you want to compare Sum to overall average, TOTAL will ignore dimension and will give you overall average.
- Mark as New
- Bookmark
- Subscribe
- Mute
- Subscribe to RSS Feed
- Permalink
- Report Inappropriate Content
Oh, thank you so much, that worked!