Unlock a world of possibilities! Login now and discover the exclusive benefits awaiting you.
- Qlik Community
- :
- Forums
- :
- Analytics
- :
- New to Qlik Analytics
- :
- Re: Color Change in qs
- Subscribe to RSS Feed
- Mark Topic as New
- Mark Topic as Read
- Float this Topic for Current User
- Bookmark
- Subscribe
- Mute
- Printer Friendly Page
- Mark as New
- Bookmark
- Subscribe
- Mute
- Subscribe to RSS Feed
- Permalink
- Report Inappropriate Content
Color Change in qs
Hi pls check the app,
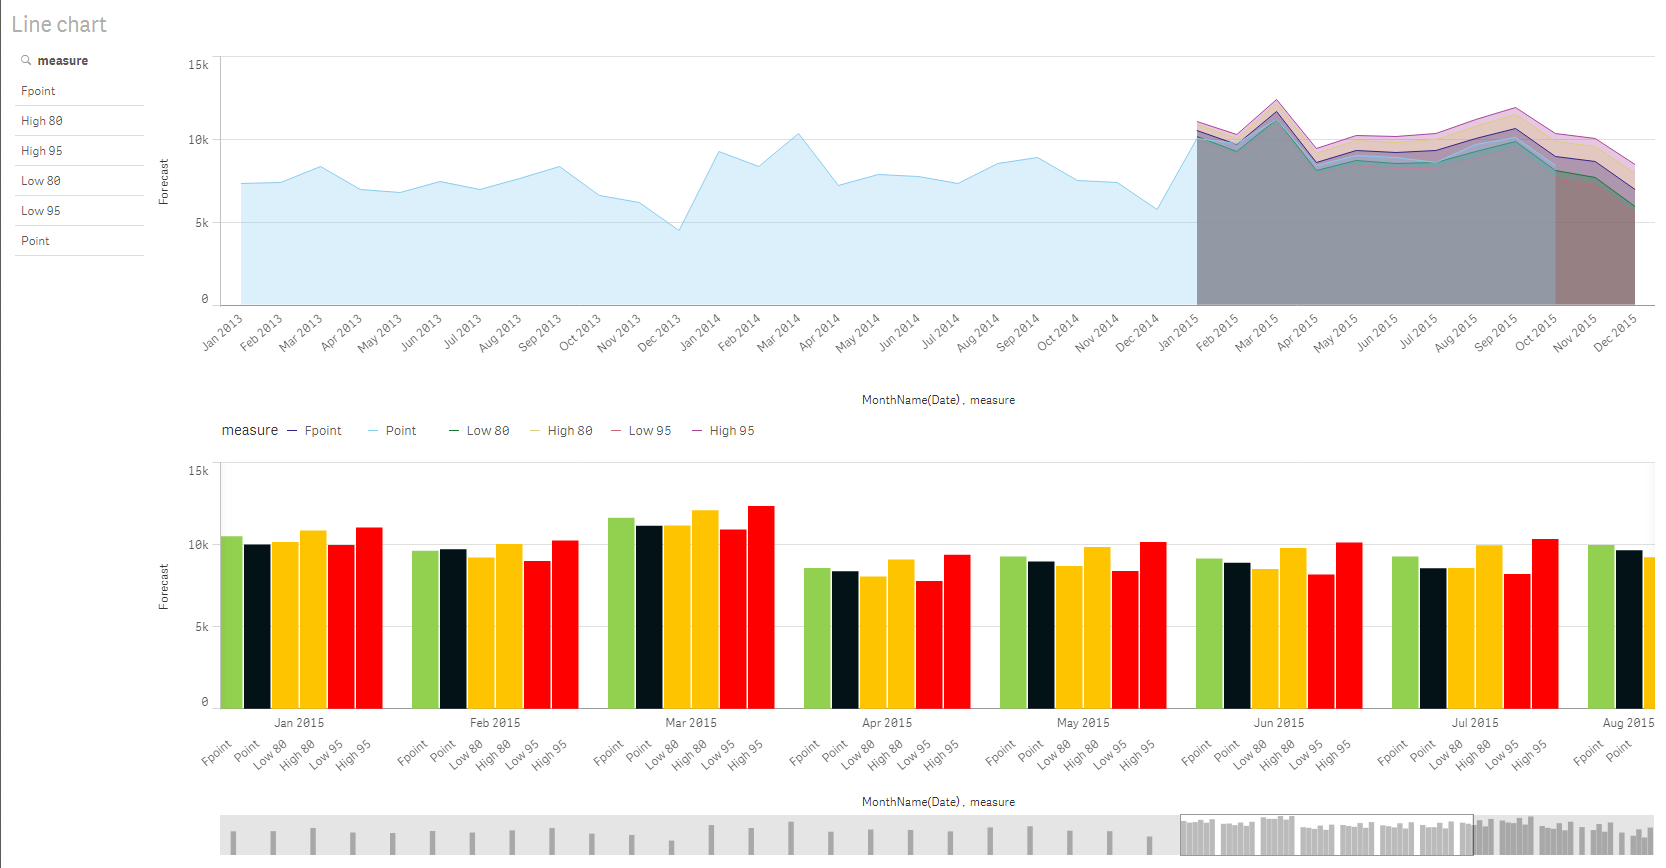
i want to change the color of BAR Chart, by default there are color blue and red , i want to change it to green and yellow..
pls suggest
- « Previous Replies
-
- 1
- 2
- Next Replies »
- Mark as New
- Bookmark
- Subscribe
- Mute
- Subscribe to RSS Feed
- Permalink
- Report Inappropriate Content
Try in Color By Expression:
if(Flag='Compile', Green(), Yellow())
- Mark as New
- Bookmark
- Subscribe
- Mute
- Subscribe to RSS Feed
- Permalink
- Report Inappropriate Content
Nopes,,not working
- Mark as New
- Bookmark
- Subscribe
- Mute
- Subscribe to RSS Feed
- Permalink
- Report Inappropriate Content
- Mark as New
- Bookmark
- Subscribe
- Mute
- Subscribe to RSS Feed
- Permalink
- Report Inappropriate Content
by this for one measure and one dimension value can be done, how to do for 2 bar chart?
- Mark as New
- Bookmark
- Subscribe
- Mute
- Subscribe to RSS Feed
- Permalink
- Report Inappropriate Content
THIS thread explain for 3 measures:
Qlik Sense: How to set custom colors by measure in a bar chart
see:
For this example, the dimension is "Segment" and the measures are "Sales", "Quota", and "Expenses". The requirement is a bar chart with Sales in green, Quota in blue, and Expenses in red.
Which is quite similar to your with 1 dimension and 2 measure
- Mark as New
- Bookmark
- Subscribe
- Mute
- Subscribe to RSS Feed
- Permalink
- Report Inappropriate Content
I dont have QS
- Mark as New
- Bookmark
- Subscribe
- Mute
- Subscribe to RSS Feed
- Permalink
- Report Inappropriate Content
Hi Abhay,
You can actually color any measure in a bar chart or line chart the way you need.
Is this what you need?
If so i am attaching a QVF for you to explore how to achive this.
Hope this helps.
- Sangram
- Mark as New
- Bookmark
- Subscribe
- Mute
- Subscribe to RSS Feed
- Permalink
- Report Inappropriate Content
Hi,
i have attached the app pls check.. there are 2 bar chart against value a .. these are colored blue and red .. i want color green and red
- Mark as New
- Bookmark
- Subscribe
- Mute
- Subscribe to RSS Feed
- Permalink
- Report Inappropriate Content
Hi Abhay,
Your QVF looks to be empty. Did you attach the right one? If you can get me that, I will get it done for you.
- Sangram
- « Previous Replies
-
- 1
- 2
- Next Replies »