Unlock a world of possibilities! Login now and discover the exclusive benefits awaiting you.
- Qlik Community
- :
- Forums
- :
- Analytics
- :
- New to Qlik Analytics
- :
- Re: Color expression for different measures
- Subscribe to RSS Feed
- Mark Topic as New
- Mark Topic as Read
- Float this Topic for Current User
- Bookmark
- Subscribe
- Mute
- Printer Friendly Page
- Mark as New
- Bookmark
- Subscribe
- Mute
- Subscribe to RSS Feed
- Permalink
- Report Inappropriate Content
Color expression for different measures
Hi,
i have this table
tbl_sales:
LOAD * Inline
[Store, Cola, Sprite, Fanta
New York,2407,6262,37526
Chicago,11600,30583,140708
San Francisco,40,100,1159
];
I create a barchart and use Store as dimension.
Cola, Sprite, Fanta as measure
I want to show each measure in a special color. How can i do it?
Next step, if the Store = Chicago the measure colors for this store should be another special colors.
Best regards,
sam
Accepted Solutions
- Mark as New
- Bookmark
- Subscribe
- Mute
- Subscribe to RSS Feed
- Permalink
- Report Inappropriate Content
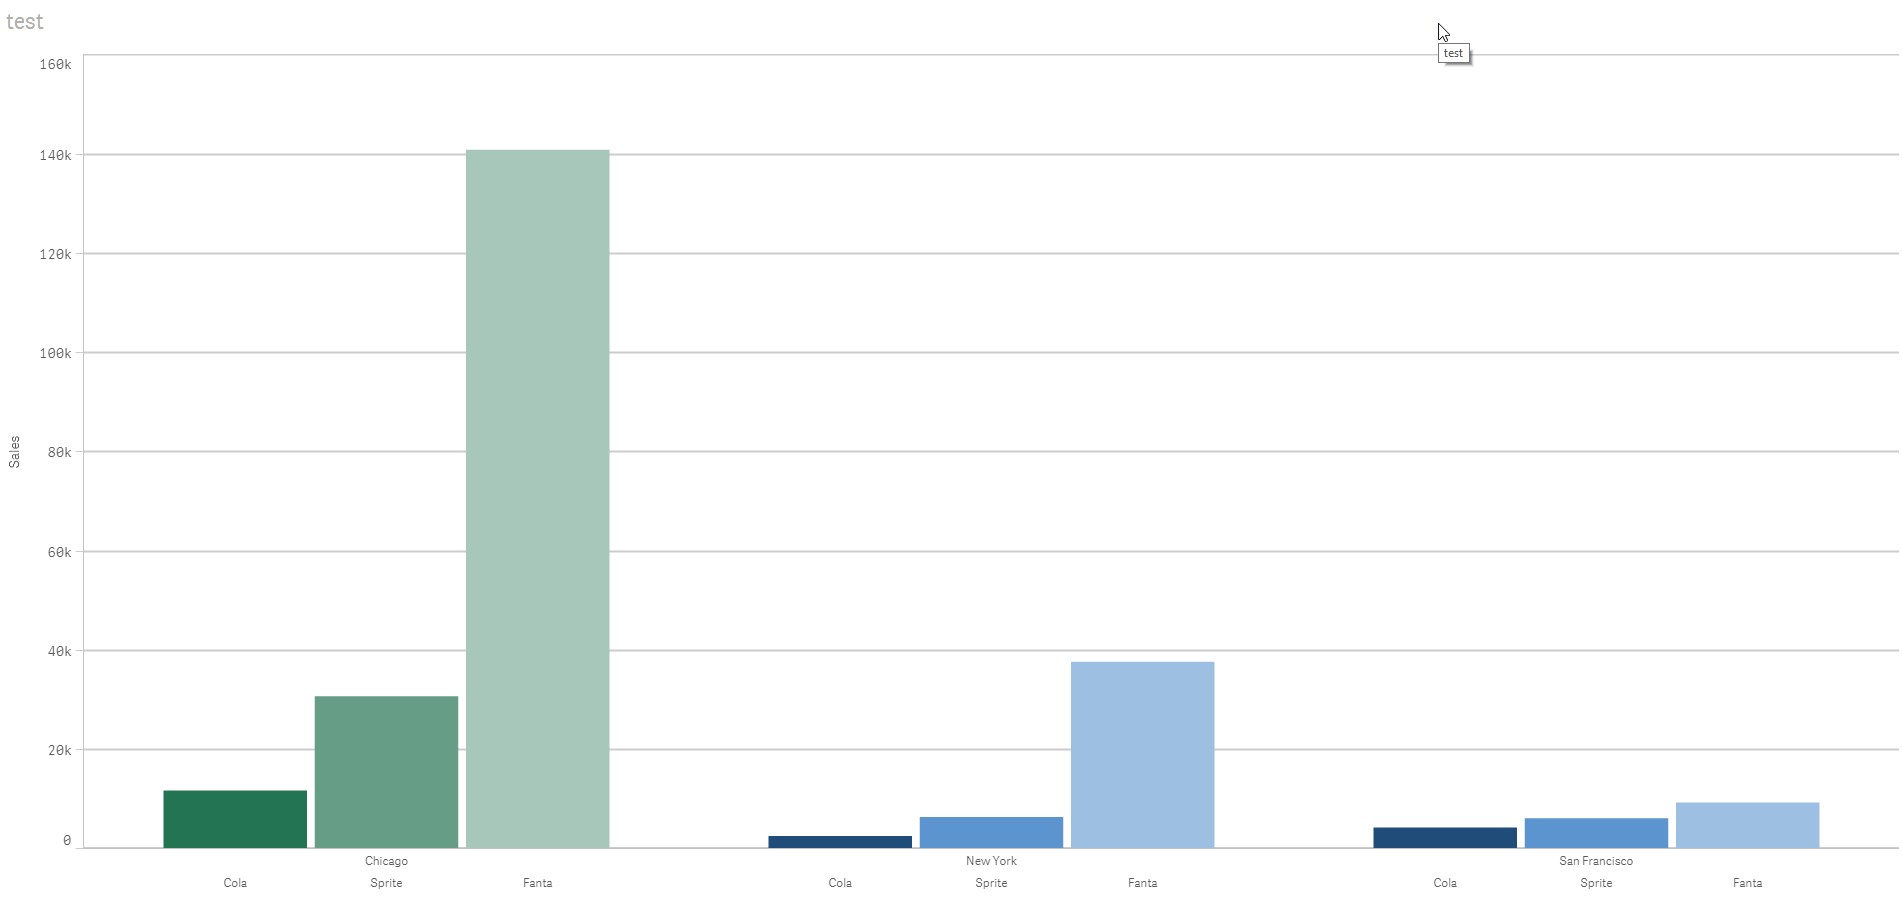
I found a solution: Qlik Sense: How to set custom colors by measure in a bar chart and added some code to show "Chicago" bars in another color.
- Mark as New
- Bookmark
- Subscribe
- Mute
- Subscribe to RSS Feed
- Permalink
- Report Inappropriate Content
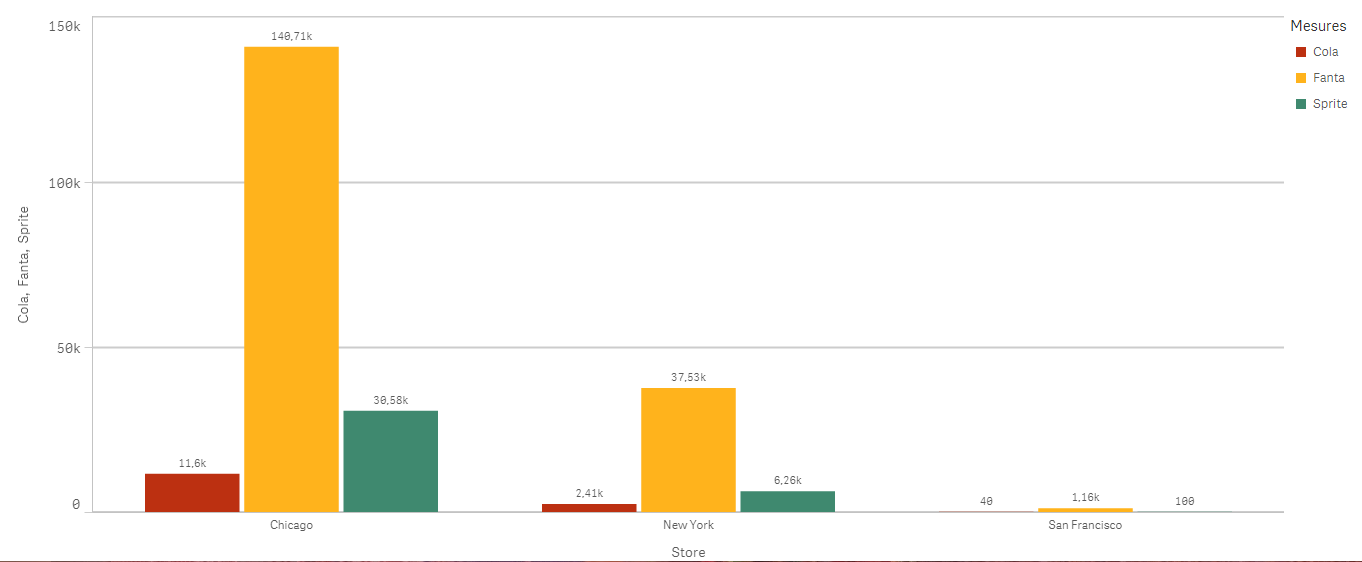
Maybe like this?
- Mark as New
- Bookmark
- Subscribe
- Mute
- Subscribe to RSS Feed
- Permalink
- Report Inappropriate Content
- Mark as New
- Bookmark
- Subscribe
- Mute
- Subscribe to RSS Feed
- Permalink
- Report Inappropriate Content
For example i want to show
Cola: #204F79
Sprite: #4F9BD9
Fanta: #BAD8F4
- Mark as New
- Bookmark
- Subscribe
- Mute
- Subscribe to RSS Feed
- Permalink
- Report Inappropriate Content
I found a solution: Qlik Sense: How to set custom colors by measure in a bar chart and added some code to show "Chicago" bars in another color.